|
Download Data (XLS File) |
|
|||||
|
|||||
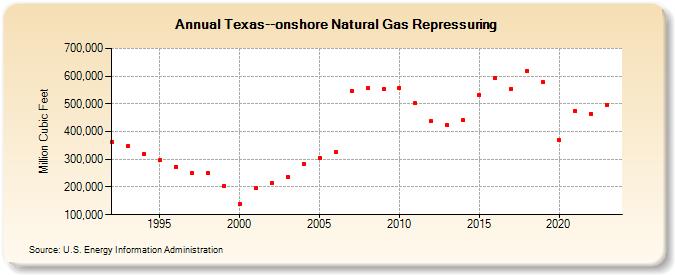
| Texas--onshore Natural Gas Repressuring (Million Cubic Feet) | |||||
| Decade | Year-0 | Year-1 | Year-2 | Year-3 | Year-4 | Year-5 | Year-6 | Year-7 | Year-8 | Year-9 |
|---|---|---|---|---|---|---|---|---|---|---|
| 1990's | 362,458 | 348,558 | 319,360 | 296,192 | 273,301 | 250,949 | 249,055 | 202,328 | ||
| 2000's | 138,372 | 195,150 | 212,638 | 237,723 | 284,491 | 303,477 | 325,967 | 546,659 | 555,796 | 552,907 |
| 2010's | 558,854 | 502,020 | 437,367 | 423,413 | 440,153 | 533,047 | 592,484 | 554,853 | 619,893 | 578,600 |
| 2020's | 368,604 | 475,329 | 463,370 | 497,260 | 549,526 |
| - = No Data Reported; -- = Not Applicable; NA = Not Available; W = Withheld to avoid disclosure of individual company data. |
| Release Date: 6/30/2026 |
| Next Release Date: 7/31/2026 |