|
Download Data (XLS File) |
|
|||||
|
|||||
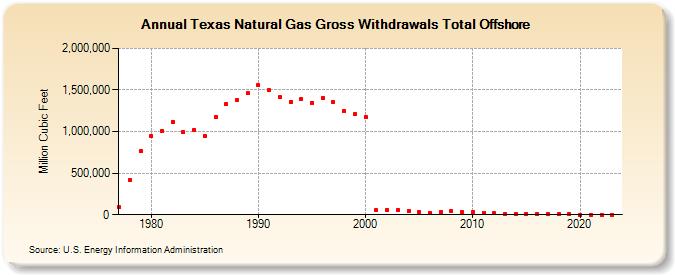
| Texas Natural Gas Gross Withdrawals Total Offshore (Million Cubic Feet) | |||||
| Decade | Year-0 | Year-1 | Year-2 | Year-3 | Year-4 | Year-5 | Year-6 | Year-7 | Year-8 | Year-9 |
|---|---|---|---|---|---|---|---|---|---|---|
| 1970's | 88,258 | 418,474 | 760,566 | |||||||
| 1980's | 949,177 | 1,010,772 | 1,120,830 | 992,041 | 1,021,260 | 942,413 | 1,169,038 | 1,330,604 | 1,376,093 | 1,457,841 |
| 1990's | 1,555,568 | 1,494,494 | 1,411,147 | 1,355,333 | 1,392,727 | 1,346,674 | 1,401,753 | 1,351,067 | 1,241,264 | 1,206,045 |
| 2000's | 1,177,257 | 53,649 | 57,063 | 53,569 | 44,946 | 36,932 | 24,785 | 29,229 | 46,786 | 37,811 |
| 2010's | 28,574 | 23,791 | 16,506 | 14,036 | 11,200 | 9,302 | 7,542 | 4,978 | 3,925 | 3,295 |
| 2020's | 2,490 | 1,403 | 2,001 | 1,184 | 1,075 |
| - = No Data Reported; -- = Not Applicable; NA = Not Available; W = Withheld to avoid disclosure of individual company data. |
| Release Date: 6/30/2026 |
| Next Release Date: 7/31/2026 |