|
Download Data (XLS File) |
|
|||||
|
|||||
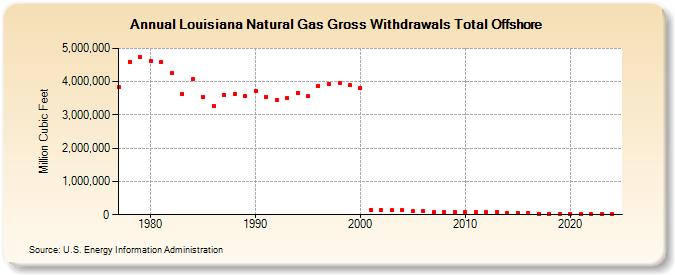
| Louisiana Natural Gas Gross Withdrawals Total Offshore (Million Cubic Feet) | |||||
| Decade | Year-0 | Year-1 | Year-2 | Year-3 | Year-4 | Year-5 | Year-6 | Year-7 | Year-8 | Year-9 |
|---|---|---|---|---|---|---|---|---|---|---|
| 1970's | 3,838,521 | 4,600,197 | 4,750,119 | |||||||
| 1980's | 4,617,585 | 4,584,491 | 4,246,464 | 3,635,942 | 4,070,279 | 3,542,827 | 3,279,165 | 3,610,041 | 3,633,594 | 3,577,685 |
| 1990's | 3,731,764 | 3,550,230 | 3,442,437 | 3,508,112 | 3,673,494 | 3,554,147 | 3,881,697 | 3,941,802 | 3,951,997 | 3,896,569 |
| 2000's | 3,812,991 | 153,871 | 137,192 | 133,456 | 129,245 | 107,584 | 97,479 | 72,868 | 86,198 | 76,386 |
| 2010's | 69,836 | 71,226 | 73,244 | 77,750 | 61,322 | 53,676 | 45,186 | 35,056 | 26,058 | 28,255 |
| 2020's | 22,777 | 17,220 | 13,062 | 8,831 | 8,639 |
| - = No Data Reported; -- = Not Applicable; NA = Not Available; W = Withheld to avoid disclosure of individual company data. |
| Release Date: 6/30/2026 |
| Next Release Date: 7/31/2026 |