|
Download Data (XLS File) |
|
|||||
|
|||||
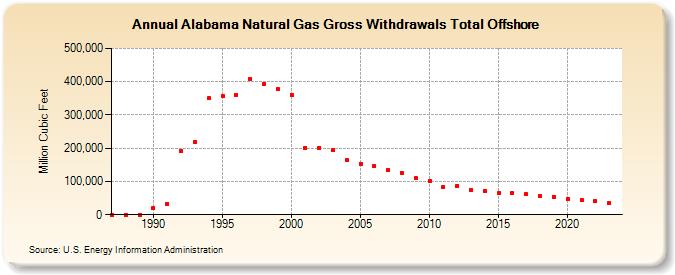
| Alabama Natural Gas Gross Withdrawals Total Offshore (Million Cubic Feet) | |||||
| Decade | Year-0 | Year-1 | Year-2 | Year-3 | Year-4 | Year-5 | Year-6 | Year-7 | Year-8 | Year-9 |
|---|---|---|---|---|---|---|---|---|---|---|
| 1980's | 0 | 9 | 13 | |||||||
| 1990's | 19,861 | 32,603 | 191,605 | 218,023 | 349,380 | 356,598 | 361,068 | 409,091 | 392,320 | 376,435 |
| 2000's | 361,289 | 200,862 | 202,002 | 194,339 | 165,630 | 152,902 | 145,762 | 134,451 | 125,502 | 109,214 |
| 2010's | 101,487 | 84,270 | 87,398 | 75,660 | 70,829 | 64,184 | 65,009 | 60,931 | 57,066 | 54,347 |
| 2020's | 48,299 | 45,501 | 41,236 | 35,915 | 30,545 |
| - = No Data Reported; -- = Not Applicable; NA = Not Available; W = Withheld to avoid disclosure of individual company data. |
| Release Date: 6/30/2026 |
| Next Release Date: 7/31/2026 |