|
Download Data (XLS File) |
|
|||||
|
|||||
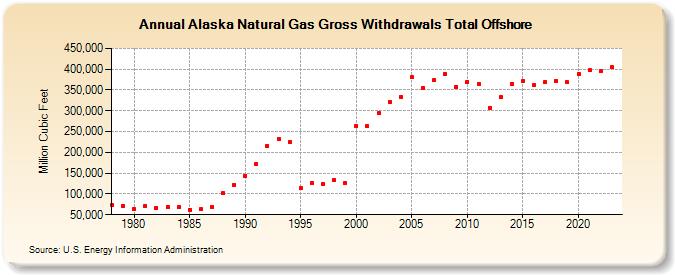
| Alaska Natural Gas Gross Withdrawals Total Offshore (Million Cubic Feet) | |||||
| Decade | Year-0 | Year-1 | Year-2 | Year-3 | Year-4 | Year-5 | Year-6 | Year-7 | Year-8 | Year-9 |
|---|---|---|---|---|---|---|---|---|---|---|
| 1970's | 72,813 | 71,946 | ||||||||
| 1980's | 63,355 | 71,477 | 66,852 | 68,776 | 68,315 | 62,454 | 63,007 | 69,656 | 101,440 | 122,595 |
| 1990's | 144,064 | 171,665 | 216,377 | 233,198 | 224,301 | 113,552 | 126,051 | 123,854 | 133,111 | 125,841 |
| 2000's | 263,958 | 262,937 | 293,580 | 322,010 | 334,125 | 380,568 | 354,816 | 374,204 | 388,188 | 357,490 |
| 2010's | 370,148 | 364,702 | 307,306 | 332,402 | 365,135 | 370,657 | 361,678 | 369,016 | 372,387 | 368,029 |
| 2020's | 389,367 | 397,641 | 396,119 | 404,250 | 420,498 |
| - = No Data Reported; -- = Not Applicable; NA = Not Available; W = Withheld to avoid disclosure of individual company data. |
| Release Date: 6/30/2026 |
| Next Release Date: 7/31/2026 |