|
Download Data (XLS File) |
|
|||||
|
|||||
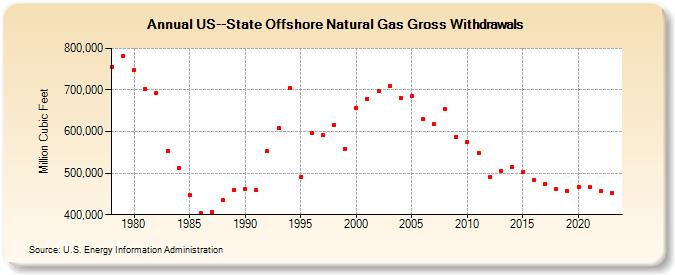
| US--State Offshore Natural Gas Gross Withdrawals (Million Cubic Feet) | |||||
| Decade | Year-0 | Year-1 | Year-2 | Year-3 | Year-4 | Year-5 | Year-6 | Year-7 | Year-8 | Year-9 |
|---|---|---|---|---|---|---|---|---|---|---|
| 1970's | 755,671 | 780,911 | ||||||||
| 1980's | 747,743 | 702,765 | 693,177 | 552,610 | 513,279 | 446,237 | 403,050 | 406,377 | 434,211 | 459,617 |
| 1990's | 462,652 | 458,800 | 552,294 | 607,435 | 704,469 | 489,576 | 597,239 | 590,815 | 615,249 | 558,692 |
| 2000's | 655,609 | 678,580 | 696,905 | 710,240 | 680,911 | 684,671 | 629,652 | 618,042 | 653,704 | 586,953 |
| 2010's | 575,601 | 549,151 | 489,505 | 505,318 | 514,291 | 502,948 | 483,900 | 474,511 | 460,835 | 458,046 |
| 2020's | 466,410 | 465,954 | 456,298 | 453,189 | 463,282 |
| - = No Data Reported; -- = Not Applicable; NA = Not Available; W = Withheld to avoid disclosure of individual company data. |
| Release Date: 6/30/2026 |
| Next Release Date: 7/31/2026 |