|
Download Data (XLS File) |
|
|||||
|
|||||
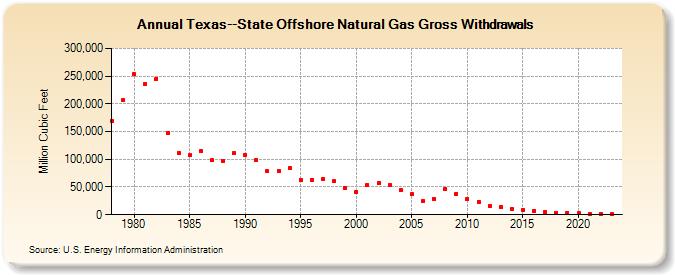
| Texas--State Offshore Natural Gas Gross Withdrawals (Million Cubic Feet) | |||||
| Decade | Year-0 | Year-1 | Year-2 | Year-3 | Year-4 | Year-5 | Year-6 | Year-7 | Year-8 | Year-9 |
|---|---|---|---|---|---|---|---|---|---|---|
| 1970's | 169,219 | 206,490 | ||||||||
| 1980's | 252,996 | 235,421 | 245,626 | 147,330 | 111,482 | 107,543 | 114,501 | 98,050 | 97,545 | 110,901 |
| 1990's | 108,404 | 98,493 | 78,263 | 79,234 | 84,573 | 63,181 | 63,340 | 64,528 | 60,298 | 48,918 |
| 2000's | 41,195 | 53,649 | 57,063 | 53,569 | 44,946 | 36,932 | 24,785 | 29,229 | 46,786 | 37,811 |
| 2010's | 28,574 | 23,791 | 16,506 | 14,036 | 11,200 | 9,302 | 7,542 | 4,978 | 3,925 | 3,295 |
| 2020's | 2,490 | 1,403 | 2,001 | 1,184 | 1,075 |
| - = No Data Reported; -- = Not Applicable; NA = Not Available; W = Withheld to avoid disclosure of individual company data. |
| Release Date: 6/30/2026 |
| Next Release Date: 7/31/2026 |