|
Download Data (XLS File) |
|
|||||
|
|||||
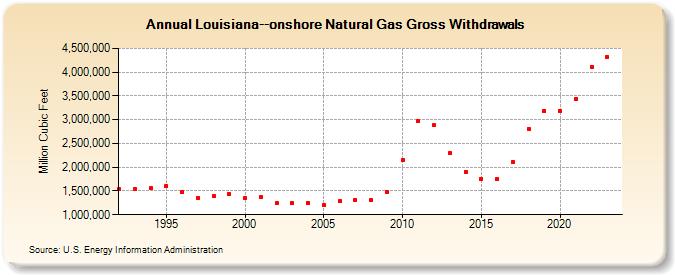
| Louisiana--onshore Natural Gas Gross Withdrawals (Million Cubic Feet) | |||||
| Decade | Year-0 | Year-1 | Year-2 | Year-3 | Year-4 | Year-5 | Year-6 | Year-7 | Year-8 | Year-9 |
|---|---|---|---|---|---|---|---|---|---|---|
| 1990's | 1,535,033 | 1,538,511 | 1,552,603 | 1,608,633 | 1,469,698 | 1,357,155 | 1,386,478 | 1,434,389 | ||
| 2000's | 1,342,963 | 1,370,802 | 1,245,270 | 1,244,672 | 1,248,050 | 1,202,328 | 1,280,758 | 1,309,960 | 1,301,523 | 1,482,252 |
| 2010's | 2,148,447 | 2,969,297 | 2,882,193 | 2,289,193 | 1,907,296 | 1,759,556 | 1,748,220 | 2,113,647 | 2,813,861 | 3,190,695 |
| 2020's | 3,188,715 | 3,431,322 | 4,114,676 | 4,347,048 | 3,608,682 |
| - = No Data Reported; -- = Not Applicable; NA = Not Available; W = Withheld to avoid disclosure of individual company data. |
| Release Date: 6/30/2026 |
| Next Release Date: 7/31/2026 |