|
Download Data (XLS File) |
|
|||||
|
|||||
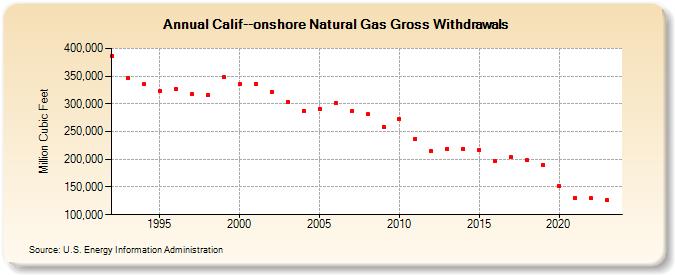
| Calif--onshore Natural Gas Gross Withdrawals (Million Cubic Feet) | |||||
| Decade | Year-0 | Year-1 | Year-2 | Year-3 | Year-4 | Year-5 | Year-6 | Year-7 | Year-8 | Year-9 |
|---|---|---|---|---|---|---|---|---|---|---|
| 1990's | 386,382 | 346,733 | 334,987 | 322,544 | 326,919 | 317,137 | 315,701 | 347,667 | ||
| 2000's | 334,983 | 336,629 | 322,138 | 303,480 | 287,205 | 291,271 | 301,921 | 286,584 | 281,088 | 258,983 |
| 2010's | 273,136 | 237,388 | 214,509 | 219,386 | 218,668 | 216,772 | 196,041 | 203,979 | 197,790 | 189,827 |
| 2020's | 151,348 | 130,619 | 129,654 | 127,287 | 119,306 |
| - = No Data Reported; -- = Not Applicable; NA = Not Available; W = Withheld to avoid disclosure of individual company data. |
| Release Date: 6/30/2026 |
| Next Release Date: 7/31/2026 |