|
Download Data (XLS File) |
|
|||||
|
|||||
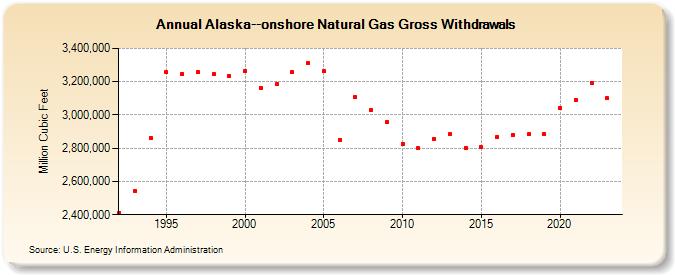
| Alaska--onshore Natural Gas Gross Withdrawals (Million Cubic Feet) | |||||
| Decade | Year-0 | Year-1 | Year-2 | Year-3 | Year-4 | Year-5 | Year-6 | Year-7 | Year-8 | Year-9 |
|---|---|---|---|---|---|---|---|---|---|---|
| 1990's | 2,409,336 | 2,545,144 | 2,861,599 | 3,256,352 | 3,247,533 | 3,257,096 | 3,245,736 | 3,236,241 | ||
| 2000's | 3,265,436 | 3,164,843 | 3,183,857 | 3,256,295 | 3,309,960 | 3,262,379 | 2,850,934 | 3,105,086 | 3,027,696 | 2,954,896 |
| 2010's | 2,826,952 | 2,798,220 | 2,857,485 | 2,882,956 | 2,803,410 | 2,804,644 | 2,868,514 | 2,881,753 | 2,882,325 | 2,882,323 |
| 2020's | 3,040,955 | 3,088,415 | 3,190,767 | 3,099,745 | 3,128,667 |
| - = No Data Reported; -- = Not Applicable; NA = Not Available; W = Withheld to avoid disclosure of individual company data. |
| Release Date: 6/30/2026 |
| Next Release Date: 7/31/2026 |