|
Download Data (XLS File) |
|
|||||
|
|||||
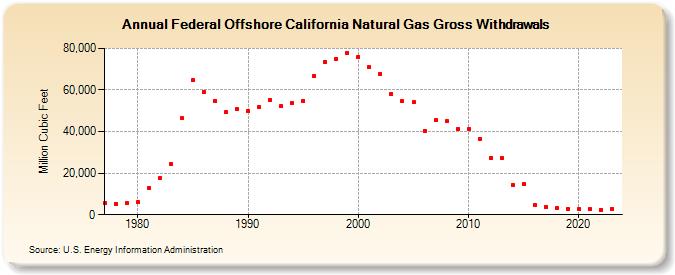
| Federal Offshore California Natural Gas Gross Withdrawals (Million Cubic Feet) | |||||
| Decade | Year-0 | Year-1 | Year-2 | Year-3 | Year-4 | Year-5 | Year-6 | Year-7 | Year-8 | Year-9 |
|---|---|---|---|---|---|---|---|---|---|---|
| 1970's | 5,417 | 5,166 | 5,431 | |||||||
| 1980's | 5,900 | 12,763 | 17,751 | 24,168 | 46,363 | 64,558 | 59,078 | 54,805 | 49,167 | 50,791 |
| 1990's | 49,972 | 51,855 | 55,231 | 52,150 | 53,561 | 54,790 | 66,784 | 73,345 | 74,985 | 77,809 |
| 2000's | 76,075 | 70,947 | 67,816 | 58,095 | 54,655 | 54,088 | 40,407 | 45,516 | 44,902 | 41,229 |
| 2010's | 41,200 | 36,579 | 27,262 | 27,454 | 14,515 | 14,748 | 4,499 | 3,950 | 3,428 | 2,876 |
| 2020's | 2,708 | 2,732 | 2,450 | 2,884 | 3,920 |
| - = No Data Reported; -- = Not Applicable; NA = Not Available; W = Withheld to avoid disclosure of individual company data. |
| Release Date: 6/30/2026 |
| Next Release Date: 7/31/2026 |