|
Download Data (XLS File) |
|
|||||
|
|||||
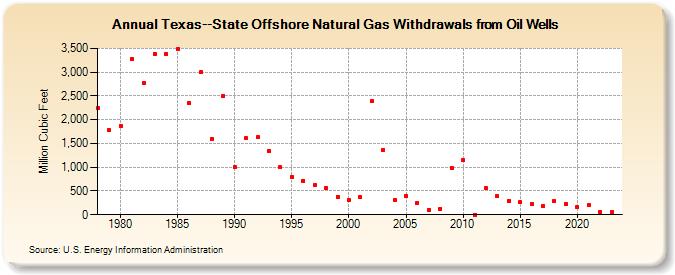
| Texas--State Offshore Natural Gas Withdrawals from Oil Wells (Million Cubic Feet) | |||||
| Decade | Year-0 | Year-1 | Year-2 | Year-3 | Year-4 | Year-5 | Year-6 | Year-7 | Year-8 | Year-9 |
|---|---|---|---|---|---|---|---|---|---|---|
| 1970's | 2,236 | 1,773 | ||||||||
| 1980's | 1,874 | 3,278 | 2,770 | 3,382 | 3,391 | 3,491 | 2,347 | 2,997 | 1,601 | 2,503 |
| 1990's | 995 | 1,608 | 1,625 | 1,350 | 996 | 801 | 716 | 625 | 565 | 380 |
| 2000's | 312 | 364 | 2,391 | 1,363 | 316 | 400 | 255 | 108 | 130 | 991 |
| 2010's | 1,153 | 0 | 552 | 386 | 298 | 265 | 224 | 185 | 284 | 222 |
| 2020's | 165 | 202 | 57 | 66 | 62 |
| - = No Data Reported; -- = Not Applicable; NA = Not Available; W = Withheld to avoid disclosure of individual company data. |
| Release Date: 6/30/2026 |
| Next Release Date: 7/31/2026 |