|
Download Data (XLS File) |
|
|||||
|
|||||
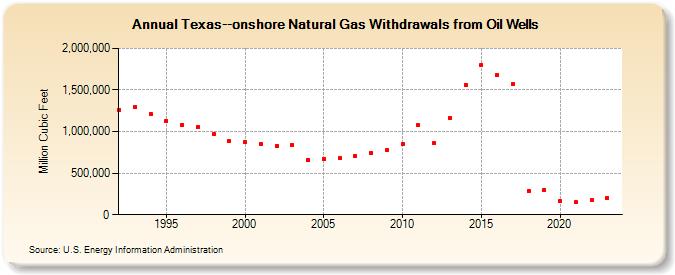
| Texas--onshore Natural Gas Withdrawals from Oil Wells (Million Cubic Feet) | |||||
| Decade | Year-0 | Year-1 | Year-2 | Year-3 | Year-4 | Year-5 | Year-6 | Year-7 | Year-8 | Year-9 |
|---|---|---|---|---|---|---|---|---|---|---|
| 1990's | 1,264,850 | 1,299,039 | 1,208,892 | 1,127,535 | 1,080,856 | 1,055,719 | 967,205 | 883,469 | ||
| 2000's | 869,272 | 854,717 | 830,425 | 842,371 | 659,535 | 674,661 | 676,394 | 703,983 | 745,458 | 773,829 |
| 2010's | 848,406 | 1,073,301 | 860,123 | 1,166,425 | 1,557,704 | 1,802,820 | 1,680,649 | 1,568,969 | 287,364 | 302,721 |
| 2020's | 162,262 | 152,749 | 176,414 | 198,411 | 195,472 |
| - = No Data Reported; -- = Not Applicable; NA = Not Available; W = Withheld to avoid disclosure of individual company data. |
| Release Date: 6/30/2026 |
| Next Release Date: 7/31/2026 |