|
Download Data (XLS File) |
|
|||||
|
|||||
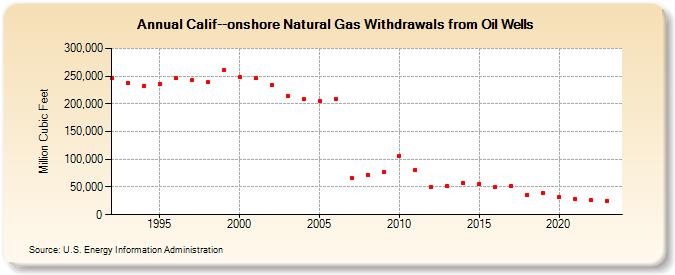
| Calif--onshore Natural Gas Withdrawals from Oil Wells (Million Cubic Feet) | |||||
| Decade | Year-0 | Year-1 | Year-2 | Year-3 | Year-4 | Year-5 | Year-6 | Year-7 | Year-8 | Year-9 |
|---|---|---|---|---|---|---|---|---|---|---|
| 1990's | 246,274 | 237,146 | 232,526 | 236,610 | 245,996 | 242,597 | 238,570 | 260,600 | ||
| 2000's | 247,840 | 245,752 | 233,169 | 214,843 | 208,232 | 204,356 | 209,558 | 66,296 | 72,281 | 76,456 |
| 2010's | 106,442 | 80,957 | 49,951 | 51,625 | 57,572 | 55,889 | 49,373 | 51,401 | 35,960 | 39,093 |
| 2020's | 31,053 | 28,476 | 26,065 | 25,542 | 22,336 |
| - = No Data Reported; -- = Not Applicable; NA = Not Available; W = Withheld to avoid disclosure of individual company data. |
| Release Date: 6/30/2026 |
| Next Release Date: 7/31/2026 |