|
Download Data (XLS File) |
|
|||||
|
|||||
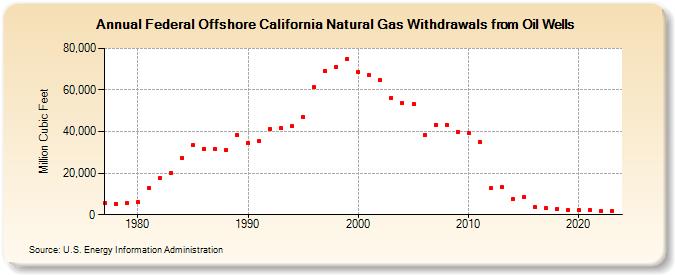
| Federal Offshore California Natural Gas Withdrawals from Oil Wells (Million Cubic Feet) | |||||
| Decade | Year-0 | Year-1 | Year-2 | Year-3 | Year-4 | Year-5 | Year-6 | Year-7 | Year-8 | Year-9 |
|---|---|---|---|---|---|---|---|---|---|---|
| 1970's | 5,417 | 5,166 | 5,431 | |||||||
| 1980's | 5,900 | 12,763 | 17,751 | 20,182 | 27,443 | 33,331 | 31,799 | 31,380 | 31,236 | 38,545 |
| 1990's | 34,332 | 35,391 | 41,284 | 41,532 | 42,497 | 46,916 | 61,276 | 69,084 | 71,019 | 75,034 |
| 2000's | 68,752 | 67,034 | 64,735 | 56,363 | 53,805 | 53,404 | 38,313 | 43,379 | 43,300 | 40,023 |
| 2010's | 39,444 | 35,020 | 12,703 | 13,158 | 7,508 | 8,603 | 3,603 | 3,146 | 2,671 | 2,249 |
| 2020's | 2,124 | 2,083 | 1,630 | 1,899 | 2,029 |
| - = No Data Reported; -- = Not Applicable; NA = Not Available; W = Withheld to avoid disclosure of individual company data. |
| Release Date: 6/30/2026 |
| Next Release Date: 7/31/2026 |