|
Download Data (XLS File) |
|
|||||
|
|||||
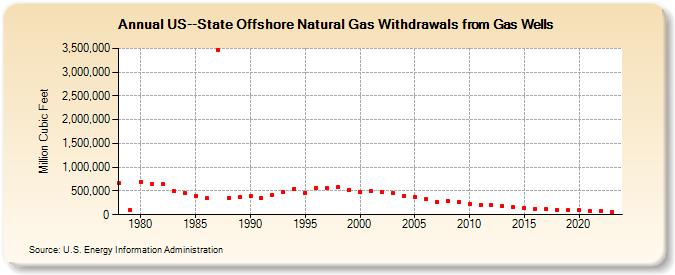
| US--State Offshore Natural Gas Withdrawals from Gas Wells (Million Cubic Feet) | |||||
| Decade | Year-0 | Year-1 | Year-2 | Year-3 | Year-4 | Year-5 | Year-6 | Year-7 | Year-8 | Year-9 |
|---|---|---|---|---|---|---|---|---|---|---|
| 1970's | 657,821 | 97,934 | ||||||||
| 1980's | 697,311 | 652,049 | 641,977 | 498,196 | 456,001 | 390,052 | 344,768 | 3,472,980 | 355,370 | 376,033 |
| 1990's | 383,544 | 359,112 | 415,486 | 470,487 | 550,079 | 460,659 | 563,746 | 559,098 | 577,177 | 527,126 |
| 2000's | 481,322 | 508,374 | 485,126 | 456,090 | 401,662 | 363,652 | 321,261 | 276,117 | 297,565 | 259,848 |
| 2010's | 234,236 | 208,970 | 204,667 | 186,887 | 158,873 | 138,512 | 130,002 | 109,865 | 103,700 | 97,546 |
| 2020's | 89,570 | 80,945 | 75,033 | 64,670 | 57,597 |
| - = No Data Reported; -- = Not Applicable; NA = Not Available; W = Withheld to avoid disclosure of individual company data. |
| Release Date: 6/30/2026 |
| Next Release Date: 7/31/2026 |