|
Download Data (XLS File) |
|
|||||
|
|||||
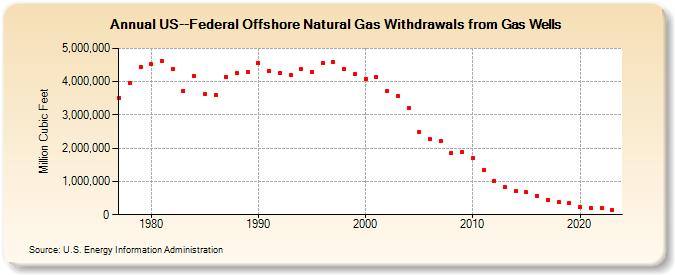
| US--Federal Offshore Natural Gas Withdrawals from Gas Wells (Million Cubic Feet) | |||||
| Decade | Year-0 | Year-1 | Year-2 | Year-3 | Year-4 | Year-5 | Year-6 | Year-7 | Year-8 | Year-9 |
|---|---|---|---|---|---|---|---|---|---|---|
| 1970's | 3,515,143 | 3,972,095 | 4,452,146 | |||||||
| 1980's | 4,516,781 | 4,613,422 | 4,372,744 | 3,720,437 | 4,183,582 | 3,614,786 | 3,585,537 | 4,134,700 | 4,249,592 | 4,286,261 |
| 1990's | 4,562,144 | 4,314,407 | 4,258,686 | 4,215,015 | 4,373,962 | 4,288,219 | 4,558,997 | 4,586,352 | 4,381,022 | 4,225,452 |
| 2000's | 4,092,681 | 4,146,993 | 3,722,249 | 3,565,614 | 3,214,488 | 2,474,076 | 2,272,669 | 2,204,379 | 1,849,891 | 1,878,928 |
| 2010's | 1,701,665 | 1,355,489 | 1,028,474 | 831,636 | 713,722 | 673,930 | 573,924 | 455,475 | 373,185 | 337,516 |
| 2020's | 237,513 | 210,517 | 205,862 | 148,895 | 116,296 |
| - = No Data Reported; -- = Not Applicable; NA = Not Available; W = Withheld to avoid disclosure of individual company data. |
| Release Date: 6/30/2026 |
| Next Release Date: 7/31/2026 |