|
Download Data (XLS File) |
|
|||||
|
|||||
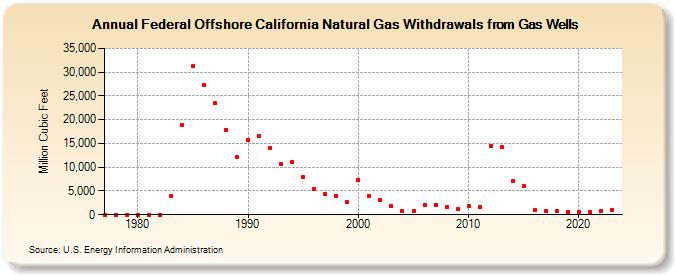
| Federal Offshore California Natural Gas Withdrawals from Gas Wells (Million Cubic Feet) | |||||
| Decade | Year-0 | Year-1 | Year-2 | Year-3 | Year-4 | Year-5 | Year-6 | Year-7 | Year-8 | Year-9 |
|---|---|---|---|---|---|---|---|---|---|---|
| 1970's | 0 | 0 | 0 | |||||||
| 1980's | 0 | 0 | 0 | 3,986 | 18,920 | 31,227 | 27,279 | 23,425 | 17,931 | 12,246 |
| 1990's | 15,640 | 16,464 | 13,947 | 10,618 | 11,064 | 7,874 | 5,508 | 4,260 | 3,966 | 2,775 |
| 2000's | 7,323 | 3,913 | 3,080 | 1,731 | 850 | 684 | 2,094 | 2,137 | 1,601 | 1,206 |
| 2010's | 1,757 | 1,560 | 14,559 | 14,296 | 7,007 | 6,145 | 896 | 804 | 757 | 627 |
| 2020's | 584 | 648 | 820 | 985 | 1,891 |
| - = No Data Reported; -- = Not Applicable; NA = Not Available; W = Withheld to avoid disclosure of individual company data. |
| Release Date: 6/30/2026 |
| Next Release Date: 7/31/2026 |