|
Download Data (XLS File) |
|
||||||||
|
||||||||
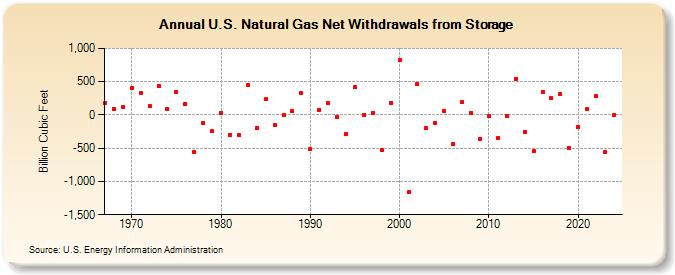
| U.S. Natural Gas Net Withdrawals from Storage (Billion Cubic Feet) | ||||||||
| Decade | Year-0 | Year-1 | Year-2 | Year-3 | Year-4 | Year-5 | Year-6 | Year-7 | Year-8 | Year-9 |
|---|---|---|---|---|---|---|---|---|---|---|
| 1960's | 185 | 96 | 117 | |||||||
| 1970's | 398 | 332 | 136 | 442 | 84 | 344 | 165 | -557 | -120 | -248 |
| 1980's | 23 | -297 | -308 | 447 | -197 | 235 | -147 | -6 | 59 | 326 |
| 1990's | -513 | 80 | 173 | -36 | -286 | 415 | 2 | 24 | -530 | 172 |
| 2000's | 829 | -1,166 | 467 | -197 | -114 | 52 | -436 | 192 | 34 | -355 |
| 2010's | -13 | -354 | -9 | 546 | -254 | -547 | 340 | 254 | 314 | -503 |
| 2020's | -180 | 83 | 280 | -555 | 6 | 112 |
| - = No Data Reported; -- = Not Applicable; NA = Not Available; W = Withheld to avoid disclosure of individual company data. |
| Release Date: 6/30/2026 |
| Next Release Date: 7/31/2026 |