|
Download Data (XLS File) |
|
||||||||
|
||||||||
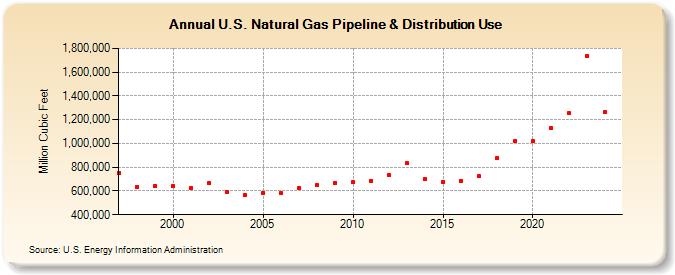
| U.S. Natural Gas Pipeline & Distribution Use (Million Cubic Feet) | ||||||||
| Decade | Year-0 | Year-1 | Year-2 | Year-3 | Year-4 | Year-5 | Year-6 | Year-7 | Year-8 | Year-9 |
|---|---|---|---|---|---|---|---|---|---|---|
| 1990's | 751,470 | 635,477 | 645,319 | |||||||
| 2000's | 642,210 | 624,964 | 666,920 | 591,492 | 566,187 | 584,026 | 584,213 | 621,364 | 647,956 | 670,174 |
| 2010's | 674,124 | 687,784 | 730,790 | 833,061 | 700,150 | 678,183 | 686,732 | 722,049 | 876,535 | 1,018,095 |
| 2020's | 1,020,360 | 1,131,472 | 1,252,302 | 1,248,395 | 1,277,710 | 1,295,753 |
| - = No Data Reported; -- = Not Applicable; NA = Not Available; W = Withheld to avoid disclosure of individual company data. |
| Release Date: 6/30/2026 |
| Next Release Date: 7/31/2026 |