|
Download Data (XLS File) |
|
||||||||
|
||||||||
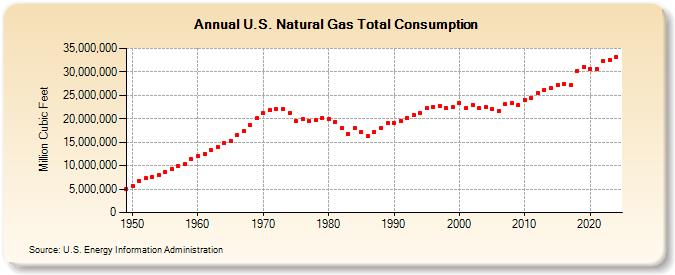
| U.S. Natural Gas Total Consumption (Million Cubic Feet) | ||||||||
| Decade | Year-0 | Year-1 | Year-2 | Year-3 | Year-4 | Year-5 | Year-6 | Year-7 | Year-8 | Year-9 |
|---|---|---|---|---|---|---|---|---|---|---|
| 1940's | 4,971,152 | |||||||||
| 1950's | 5,766,542 | 6,810,162 | 7,294,320 | 7,639,270 | 8,048,504 | 8,693,657 | 9,288,865 | 9,846,139 | 10,302,608 | 11,321,181 |
| 1960's | 11,966,537 | 12,489,268 | 13,266,513 | 13,970,229 | 14,813,808 | 15,279,716 | 16,452,403 | 17,388,360 | 18,632,062 | 20,056,240 |
| 1970's | 21,139,386 | 21,793,454 | 22,101,451 | 22,049,363 | 21,223,133 | 19,537,593 | 19,946,496 | 19,520,581 | 19,627,478 | 20,240,761 |
| 1980's | 19,877,293 | 19,403,858 | 18,001,055 | 16,834,912 | 17,950,527 | 17,280,943 | 16,221,296 | 17,210,809 | 18,029,585 | 19,118,997 |
| 1990's | 19,173,556 | 19,562,067 | 20,228,228 | 20,789,842 | 21,247,098 | 22,206,889 | 22,609,080 | 22,737,342 | 22,245,956 | 22,405,151 |
| 2000's | 23,333,121 | 22,238,624 | 23,027,021 | 22,276,502 | 22,402,546 | 22,014,434 | 21,699,071 | 23,103,793 | 23,277,008 | 22,910,078 |
| 2010's | 24,086,797 | 24,477,425 | 25,538,487 | 26,155,071 | 26,593,375 | 27,243,858 | 27,444,220 | 27,139,699 | 30,138,930 | 31,132,041 |
| 2020's | 30,602,565 | 30,645,707 | 32,291,914 | 32,591,944 | 33,055,901 | 33,522,688 |
| - = No Data Reported; -- = Not Applicable; NA = Not Available; W = Withheld to avoid disclosure of individual company data. |
| Release Date: 6/30/2026 |
| Next Release Date: 7/31/2026 |