|
Download Data (XLS File) |
|
||||||||
|
||||||||
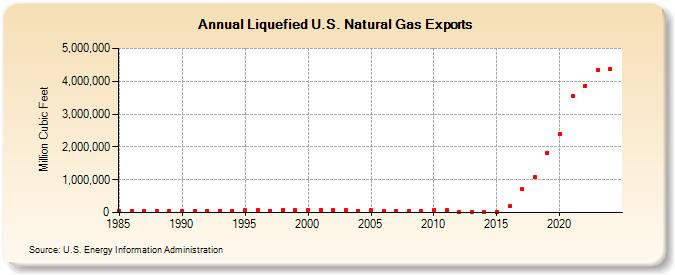
| Liquefied U.S. Natural Gas Exports (Million Cubic Feet) | ||||||||
| Decade | Year-0 | Year-1 | Year-2 | Year-3 | Year-4 | Year-5 | Year-6 | Year-7 | Year-8 | Year-9 |
|---|---|---|---|---|---|---|---|---|---|---|
| 1980's | 52,883 | 50,172 | 48,599 | 51,573 | 51,424 | |||||
| 1990's | 52,546 | 54,005 | 52,532 | 55,989 | 62,682 | 65,283 | 67,648 | 62,187 | 65,984 | 63,882 |
| 2000's | 66,028 | 66,218 | 63,842 | 66,075 | 62,467 | 65,367 | 60,938 | 48,485 | 39,217 | 33,355 |
| 2010's | 64,793 | 70,001 | 28,298 | 2,924 | 16,255 | 28,381 | 186,841 | 707,542 | 1,083,118 | 1,819,547 |
| 2020's | 2,389,963 | 3,560,818 | 3,865,643 | 4,343,027 | 4,367,170 | 5,508,235 |
| - = No Data Reported; -- = Not Applicable; NA = Not Available; W = Withheld to avoid disclosure of individual company data. |
| Release Date: 5/29/2026 |
| Next Release Date: 6/30/2026 |