|
Download Data (XLS File) |
|
||||||||
|
||||||||
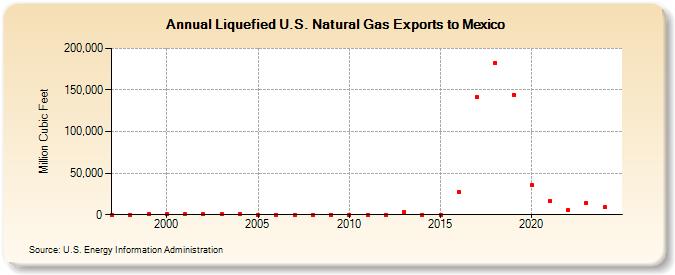
| Liquefied U.S. Natural Gas Exports to Mexico (Million Cubic Feet) | ||||||||
| Decade | Year-0 | Year-1 | Year-2 | Year-3 | Year-4 | Year-5 | Year-6 | Year-7 | Year-8 | Year-9 |
|---|---|---|---|---|---|---|---|---|---|---|
| 1990's | 0 | 33 | 275 | |||||||
| 2000's | 418 | 465 | 403 | 376 | 368 | 242 | 173 | 87 | 53 | 84 |
| 2010's | 208 | 236 | 153 | 2,852 | 181 | 195 | 27,845 | 141,434 | 182,834 | 144,476 |
| 2020's | 35,230 | 16,450 | 5,383 | 14,265 | 11,312 | 10,849 |
| - = No Data Reported; -- = Not Applicable; NA = Not Available; W = Withheld to avoid disclosure of individual company data. |
| Release Date: 6/30/2026 |
| Next Release Date: 7/31/2026 |