|
Download Data (XLS File) |
|
||||||||
|
||||||||
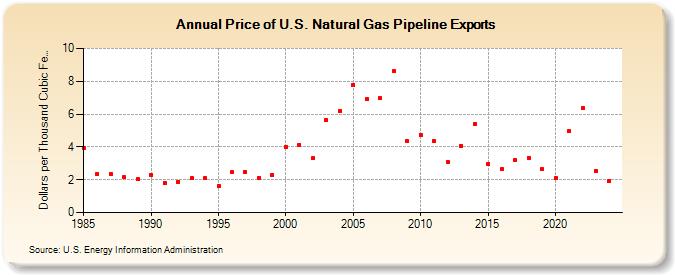
| Price of U.S. Natural Gas Pipeline Exports (Dollars per Thousand Cubic Feet) | ||||||||
| Decade | Year-0 | Year-1 | Year-2 | Year-3 | Year-4 | Year-5 | Year-6 | Year-7 | Year-8 | Year-9 |
|---|---|---|---|---|---|---|---|---|---|---|
| 1980's | 3.92 | 2.35 | 2.35 | 2.14 | 2.05 | |||||
| 1990's | 2.31 | 1.79 | 1.88 | 2.08 | 2.08 | 1.64 | 2.45 | 2.49 | 2.13 | 2.30 |
| 2000's | 4.02 | 4.14 | 3.32 | 5.66 | 6.18 | 7.77 | 6.90 | 6.96 | 8.62 | 4.34 |
| 2010's | 4.75 | 4.35 | 3.08 | 4.06 | 5.40 | 2.95 | 2.63 | 3.20 | 3.34 | 2.64 |
| 2020's | 2.10 | 4.94 | 6.34 | 2.65 | 1.95 | 3.02 |
| - = No Data Reported; -- = Not Applicable; NA = Not Available; W = Withheld to avoid disclosure of individual company data. |
| Release Date: 6/30/2026 |
| Next Release Date: 7/31/2026 |