|
Download Data (XLS File) |
|
||||||||
|
||||||||
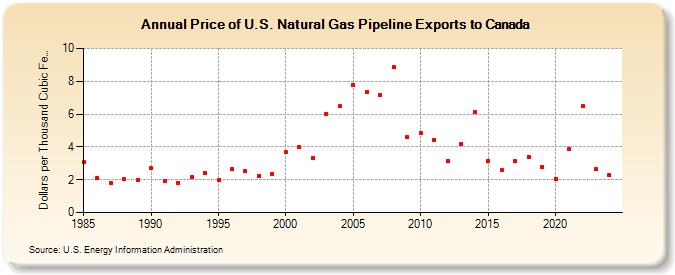
| Price of U.S. Natural Gas Pipeline Exports to Canada (Dollars per Thousand Cubic Feet) | ||||||||
| Decade | Year-0 | Year-1 | Year-2 | Year-3 | Year-4 | Year-5 | Year-6 | Year-7 | Year-8 | Year-9 |
|---|---|---|---|---|---|---|---|---|---|---|
| 1980's | 3.06 | 2.12 | 1.81 | 2.02 | 2.00 | |||||
| 1990's | 2.70 | 1.91 | 1.83 | 2.14 | 2.42 | 1.96 | 2.67 | 2.52 | 2.25 | 2.35 |
| 2000's | 3.66 | 3.97 | 3.35 | 6.03 | 6.47 | 7.80 | 7.32 | 7.17 | 8.86 | 4.59 |
| 2010's | 4.84 | 4.45 | 3.17 | 4.17 | 6.10 | 3.15 | 2.60 | 3.12 | 3.41 | 2.78 |
| 2020's | 2.06 | 3.87 | 6.49 | 2.64 | 2.27 | 3.67 |
| - = No Data Reported; -- = Not Applicable; NA = Not Available; W = Withheld to avoid disclosure of individual company data. |
| Release Date: 6/30/2026 |
| Next Release Date: 7/31/2026 |