|
Download Data (XLS File) |
|
||||||||
|
||||||||
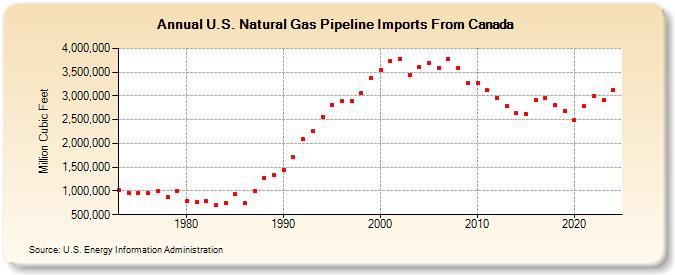
| U.S. Natural Gas Pipeline Imports From Canada (Million Cubic Feet) | ||||||||
| Decade | Year-0 | Year-1 | Year-2 | Year-3 | Year-4 | Year-5 | Year-6 | Year-7 | Year-8 | Year-9 |
|---|---|---|---|---|---|---|---|---|---|---|
| 1970's | 1,027,883 | 959,063 | 948,115 | 953,613 | 997,295 | 881,123 | 1,000,775 | |||
| 1980's | 796,507 | 762,113 | 783,407 | 711,923 | 755,368 | 926,056 | 748,780 | 992,532 | 1,276,322 | 1,339,357 |
| 1990's | 1,448,065 | 1,709,716 | 2,094,387 | 2,266,751 | 2,566,049 | 2,816,408 | 2,883,277 | 2,899,152 | 3,052,073 | 3,367,545 |
| 2000's | 3,543,966 | 3,728,537 | 3,784,978 | 3,437,230 | 3,606,543 | 3,700,454 | 3,589,995 | 3,782,708 | 3,589,089 | 3,271,107 |
| 2010's | 3,279,752 | 3,117,081 | 2,962,827 | 2,785,427 | 2,634,375 | 2,625,359 | 2,916,913 | 2,953,524 | 2,808,720 | 2,686,564 |
| 2020's | 2,499,955 | 2,784,438 | 2,997,435 | 2,911,361 | 3,127,280 | 3,149,326 |
| - = No Data Reported; -- = Not Applicable; NA = Not Available; W = Withheld to avoid disclosure of individual company data. |
| Release Date: 6/30/2026 |
| Next Release Date: 7/31/2026 |