|
Download Data (XLS File) |
|
||||||||
|
||||||||
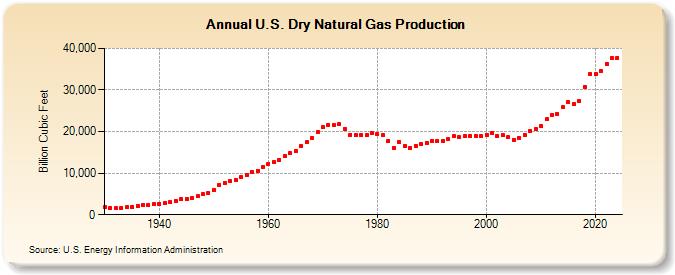
| U.S. Dry Natural Gas Production (Billion Cubic Feet) | ||||||||
| Decade | Year-0 | Year-1 | Year-2 | Year-3 | Year-4 | Year-5 | Year-6 | Year-7 | Year-8 | Year-9 |
|---|---|---|---|---|---|---|---|---|---|---|
| 1930's | 1,904 | 1,660 | 1,542 | 1,548 | 1,764 | 1,913 | 2,164 | 2,403 | 2,285 | 2,465 |
| 1940's | 2,654 | 2,778 | 3,027 | 3,394 | 3,672 | 3,882 | 3,987 | 4,393 | 4,939 | 5,195 |
| 1950's | 6,022 | 7,165 | 7,694 | 8,057 | 8,388 | 9,029 | 9,664 | 10,247 | 10,572 | 11,548 |
| 1960's | 12,228 | 12,662 | 13,253 | 14,076 | 14,824 | 15,286 | 16,467 | 17,387 | 18,495 | 19,832 |
| 1970's | 21,014 | 21,610 | 21,624 | 21,731 | 20,713 | 19,236 | 19,098 | 19,163 | 19,122 | 19,663 |
| 1980's | 19,403 | 19,181 | 17,820 | 16,094 | 17,466 | 16,454 | 16,059 | 16,621 | 17,103 | 17,311 |
| 1990's | 17,810 | 17,698 | 17,840 | 18,095 | 18,821 | 18,599 | 18,854 | 18,902 | 19,024 | 18,832 |
| 2000's | 19,182 | 19,616 | 18,928 | 19,099 | 18,591 | 18,051 | 18,504 | 19,266 | 20,159 | 20,624 |
| 2010's | 21,316 | 22,902 | 24,033 | 24,206 | 25,890 | 27,065 | 26,592 | 27,341 | 30,774 | 33,899 |
| 2020's | 33,811 | 34,529 | 36,255 | 37,652 | 37,725 | 39,288 |
| - = No Data Reported; -- = Not Applicable; NA = Not Available; W = Withheld to avoid disclosure of individual company data. |
| Release Date: 7/31/2026 |
| Next Release Date: 8/31/2026 |