|
Download Data (XLS File) |
|
||||||||
|
||||||||
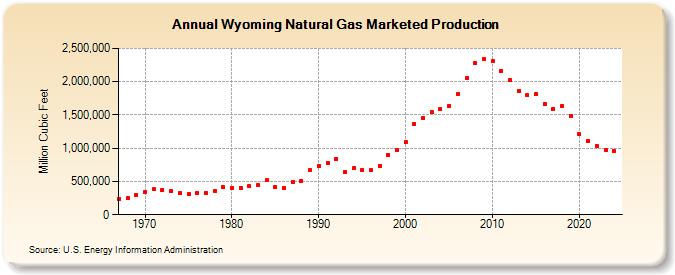
| Wyoming Natural Gas Marketed Production (Million Cubic Feet) | ||||||||
| Decade | Year-0 | Year-1 | Year-2 | Year-3 | Year-4 | Year-5 | Year-6 | Year-7 | Year-8 | Year-9 |
|---|---|---|---|---|---|---|---|---|---|---|
| 1960's | 240,074 | 248,481 | 303,517 | |||||||
| 1970's | 338,520 | 380,105 | 375,059 | 357,731 | 326,657 | 316,123 | 328,768 | 330,180 | 357,267 | 414,416 |
| 1980's | 407,072 | 408,356 | 424,657 | 443,988 | 516,683 | 416,565 | 403,266 | 497,980 | 509,058 | 665,699 |
| 1990's | 735,728 | 776,528 | 842,576 | 634,957 | 696,018 | 673,775 | 666,036 | 738,368 | 903,836 | 971,230 |
| 2000's | 1,088,328 | 1,363,879 | 1,453,957 | 1,539,318 | 1,592,203 | 1,639,317 | 1,816,201 | 2,047,882 | 2,274,850 | 2,335,328 |
| 2010's | 2,305,525 | 2,159,422 | 2,022,275 | 1,858,207 | 1,794,413 | 1,808,519 | 1,662,909 | 1,590,059 | 1,637,517 | 1,488,854 |
| 2020's | 1,206,122 | 1,109,416 | 1,033,391 | 1,027,690 | 1,052,320 | 938,131 |
| - = No Data Reported; -- = Not Applicable; NA = Not Available; W = Withheld to avoid disclosure of individual company data. |
| Release Date: 6/30/2026 |
| Next Release Date: 7/31/2026 |