|
Download Data (XLS File) |
|
||||||||
|
||||||||
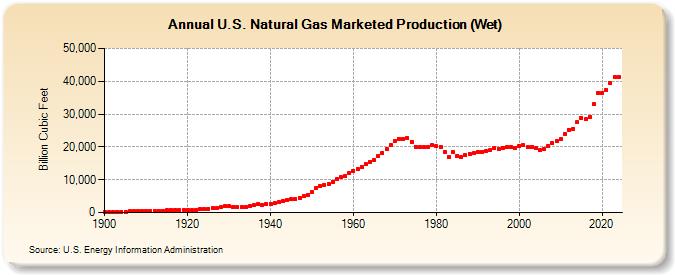
| U.S. Natural Gas Marketed Production (Wet) (Billion Cubic Feet) | ||||||||
| Decade | Year-0 | Year-1 | Year-2 | Year-3 | Year-4 | Year-5 | Year-6 | Year-7 | Year-8 | Year-9 |
|---|---|---|---|---|---|---|---|---|---|---|
| 1900's | 128 | 180 | 206 | 239 | 257 | 320 | 389 | 407 | 402 | 481 |
| 1910's | 509 | 513 | 562 | 582 | 592 | 629 | 753 | 795 | 721 | 746 |
| 1920's | 812 | 674 | 776 | 1,025 | 1,162 | 1,210 | 1,336 | 1,471 | 1,596 | 1,952 |
| 1930's | 1,979 | 1,722 | 1,594 | 1,597 | 1,816 | 1,969 | 2,225 | 2,473 | 2,358 | 2,538 |
| 1940's | 2,734 | 2,894 | 3,146 | 3,516 | 3,815 | 4,042 | 4,153 | 4,582 | 5,148 | 5,420 |
| 1950's | 6,282 | 7,457 | 8,013 | 8,397 | 8,743 | 9,405 | 10,082 | 10,680 | 11,030 | 12,046 |
| 1960's | 12,771 | 13,254 | 13,877 | 14,747 | 15,547 | 16,040 | 17,207 | 18,171 | 19,322 | 20,698 |
| 1970's | 21,921 | 22,493 | 22,532 | 22,648 | 21,601 | 20,109 | 19,952 | 20,025 | 19,974 | 20,471 |
| 1980's | 20,180 | 19,956 | 18,582 | 16,884 | 18,304 | 17,270 | 16,859 | 17,433 | 17,918 | 18,095 |
| 1990's | 18,594 | 18,532 | 18,712 | 18,982 | 19,710 | 19,506 | 19,812 | 19,866 | 19,961 | 19,805 |
| 2000's | 20,198 | 20,570 | 19,885 | 19,974 | 19,517 | 18,927 | 19,410 | 20,196 | 21,112 | 21,648 |
| 2010's | 22,382 | 24,036 | 25,283 | 25,562 | 27,498 | 28,772 | 28,400 | 29,238 | 33,009 | 36,447 |
| 2020's | 36,521 | 37,338 | 39,329 | 41,038 | 41,384 | 43,249 |
| - = No Data Reported; -- = Not Applicable; NA = Not Available; W = Withheld to avoid disclosure of individual company data. |
| Release Date: 3/31/2026 |
| Next Release Date: 4/30/2026 |