|
Download Data (XLS File) |
|
||||||||
|
||||||||
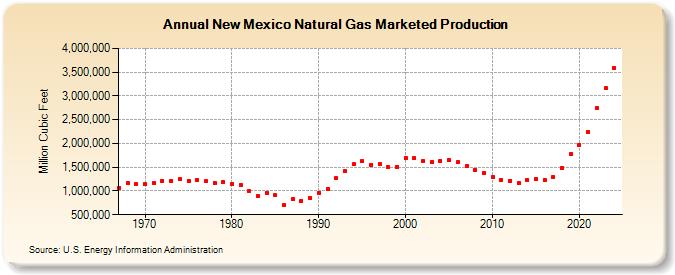
| New Mexico Natural Gas Marketed Production (Million Cubic Feet) | ||||||||
| Decade | Year-0 | Year-1 | Year-2 | Year-3 | Year-4 | Year-5 | Year-6 | Year-7 | Year-8 | Year-9 |
|---|---|---|---|---|---|---|---|---|---|---|
| 1960's | 1,067,510 | 1,164,182 | 1,138,133 | |||||||
| 1970's | 1,138,980 | 1,167,577 | 1,216,061 | 1,218,749 | 1,244,779 | 1,217,430 | 1,230,976 | 1,202,973 | 1,174,198 | 1,181,363 |
| 1980's | 1,148,086 | 1,132,066 | 991,178 | 895,279 | 957,366 | 905,272 | 702,614 | 823,773 | 791,819 | 854,615 |
| 1990's | 965,104 | 1,038,284 | 1,268,863 | 1,409,429 | 1,557,689 | 1,625,837 | 1,554,087 | 1,558,633 | 1,501,098 | 1,511,671 |
| 2000's | 1,695,295 | 1,689,125 | 1,632,080 | 1,604,015 | 1,632,539 | 1,645,166 | 1,609,223 | 1,517,922 | 1,446,204 | 1,383,004 |
| 2010's | 1,292,185 | 1,237,303 | 1,215,773 | 1,171,640 | 1,229,519 | 1,245,145 | 1,229,647 | 1,299,732 | 1,493,082 | 1,769,086 |
| 2020's | 1,965,533 | 2,237,165 | 2,739,314 | 3,169,432 | 3,599,780 | 4,130,971 |
| - = No Data Reported; -- = Not Applicable; NA = Not Available; W = Withheld to avoid disclosure of individual company data. |
| Release Date: 6/30/2026 |
| Next Release Date: 7/31/2026 |