|
Download Data (XLS File) |
|
||||||||
|
||||||||
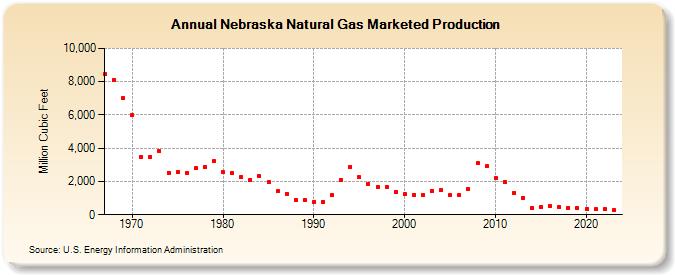
| Nebraska Natural Gas Marketed Production (Million Cubic Feet) | ||||||||
| Decade | Year-0 | Year-1 | Year-2 | Year-3 | Year-4 | Year-5 | Year-6 | Year-7 | Year-8 | Year-9 |
|---|---|---|---|---|---|---|---|---|---|---|
| 1960's | 8,453 | 8,129 | 6,989 | |||||||
| 1970's | 5,991 | 3,496 | 3,478 | 3,836 | 2,538 | 2,565 | 2,511 | 2,789 | 2,882 | 3,208 |
| 1980's | 2,550 | 2,519 | 2,280 | 2,091 | 2,300 | 1,944 | 1,403 | 1,261 | 910 | 878 |
| 1990's | 793 | 784 | 1,177 | 2,114 | 2,898 | 2,240 | 1,876 | 1,670 | 1,695 | 1,395 |
| 2000's | 1,218 | 1,208 | 1,188 | 1,454 | 1,476 | 1,172 | 1,200 | 1,555 | 3,082 | 2,908 |
| 2010's | 2,231 | 1,959 | 1,328 | 1,032 | 417 | 477 | 526 | 455 | 433 | 384 |
| 2020's | 351 | 327 | 320 | 265 | 261 |
| - = No Data Reported; -- = Not Applicable; NA = Not Available; W = Withheld to avoid disclosure of individual company data. |
| Release Date: 6/30/2026 |
| Next Release Date: 7/31/2026 |