|
Download Data (XLS File) |
|
||||||||
|
||||||||
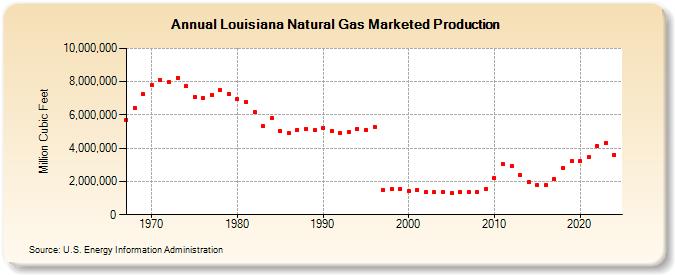
| Louisiana Natural Gas Marketed Production (Million Cubic Feet) | ||||||||
| Decade | Year-0 | Year-1 | Year-2 | Year-3 | Year-4 | Year-5 | Year-6 | Year-7 | Year-8 | Year-9 |
|---|---|---|---|---|---|---|---|---|---|---|
| 1960's | 5,716,857 | 6,416,015 | 7,227,826 | |||||||
| 1970's | 7,788,276 | 8,081,907 | 7,972,678 | 8,242,423 | 7,753,631 | 7,090,645 | 7,006,596 | 7,215,006 | 7,476,497 | 7,266,217 |
| 1980's | 6,939,924 | 6,780,184 | 6,171,627 | 5,332,113 | 5,825,055 | 5,013,702 | 4,895,394 | 5,122,509 | 5,180,267 | 5,078,125 |
| 1990's | 5,241,989 | 5,034,361 | 4,914,300 | 4,991,138 | 5,169,705 | 5,108,366 | 5,289,742 | 1,505,014 | 1,551,979 | 1,566,916 |
| 2000's | 1,455,014 | 1,502,086 | 1,361,751 | 1,350,399 | 1,353,249 | 1,296,048 | 1,361,119 | 1,365,333 | 1,377,969 | 1,548,607 |
| 2010's | 2,210,099 | 3,029,206 | 2,955,437 | 2,360,202 | 1,960,813 | 1,805,197 | 1,784,396 | 2,139,830 | 2,832,404 | 3,212,318 |
| 2020's | 3,205,574 | 3,443,767 | 4,122,441 | 4,352,670 | 3,614,212 | 3,813,990 |
| - = No Data Reported; -- = Not Applicable; NA = Not Available; W = Withheld to avoid disclosure of individual company data. |
| Release Date: 6/30/2026 |
| Next Release Date: 7/31/2026 |