|
Download Data (XLS File) |
|
||||||||
|
||||||||
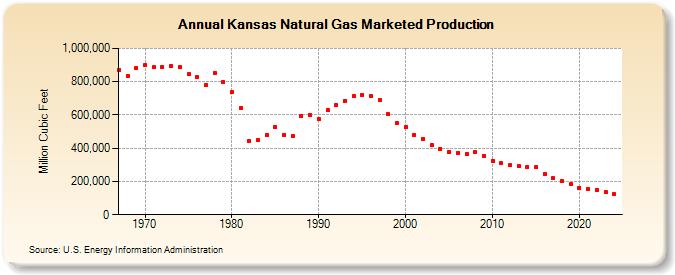
| Kansas Natural Gas Marketed Production (Million Cubic Feet) | ||||||||
| Decade | Year-0 | Year-1 | Year-2 | Year-3 | Year-4 | Year-5 | Year-6 | Year-7 | Year-8 | Year-9 |
|---|---|---|---|---|---|---|---|---|---|---|
| 1960's | 871,971 | 835,555 | 883,156 | |||||||
| 1970's | 899,955 | 885,144 | 889,268 | 893,118 | 886,782 | 843,625 | 829,170 | 781,289 | 854,484 | 797,762 |
| 1980's | 735,035 | 640,114 | 440,951 | 447,207 | 480,211 | 528,032 | 478,963 | 472,752 | 592,845 | 601,196 |
| 1990's | 573,603 | 628,459 | 658,007 | 686,347 | 712,730 | 721,436 | 712,796 | 687,215 | 603,586 | 553,419 |
| 2000's | 525,729 | 480,145 | 454,901 | 418,893 | 397,121 | 377,229 | 371,044 | 365,877 | 374,310 | 354,440 |
| 2010's | 324,720 | 309,124 | 296,299 | 292,467 | 286,480 | 284,184 | 244,795 | 219,639 | 201,391 | 183,087 |
| 2020's | 163,362 | 152,986 | 147,950 | 136,897 | 125,943 | 122,273 |
| - = No Data Reported; -- = Not Applicable; NA = Not Available; W = Withheld to avoid disclosure of individual company data. |
| Release Date: 6/30/2026 |
| Next Release Date: 7/31/2026 |