|
Download Data (XLS File) |
|
||||||||
|
||||||||
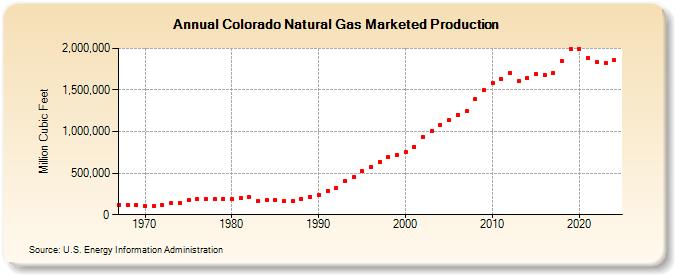
| Colorado Natural Gas Marketed Production (Million Cubic Feet) | ||||||||
| Decade | Year-0 | Year-1 | Year-2 | Year-3 | Year-4 | Year-5 | Year-6 | Year-7 | Year-8 | Year-9 |
|---|---|---|---|---|---|---|---|---|---|---|
| 1960's | 116,857 | 121,424 | 118,754 | |||||||
| 1970's | 105,804 | 108,537 | 116,949 | 137,725 | 144,629 | 171,629 | 183,972 | 188,792 | 183,693 | 191,239 |
| 1980's | 188,001 | 195,706 | 209,892 | 163,545 | 173,257 | 178,233 | 163,684 | 164,557 | 191,544 | 216,737 |
| 1990's | 242,997 | 285,961 | 323,041 | 400,985 | 453,207 | 523,084 | 572,071 | 637,375 | 696,321 | 722,738 |
| 2000's | 752,985 | 817,206 | 937,245 | 1,011,285 | 1,079,235 | 1,133,086 | 1,202,821 | 1,242,571 | 1,389,399 | 1,499,070 |
| 2010's | 1,578,379 | 1,637,576 | 1,709,376 | 1,604,860 | 1,643,487 | 1,688,733 | 1,685,755 | 1,706,364 | 1,847,402 | 1,986,916 |
| 2020's | 1,996,740 | 1,890,260 | 1,832,855 | 1,826,135 | 1,854,658 |
| - = No Data Reported; -- = Not Applicable; NA = Not Available; W = Withheld to avoid disclosure of individual company data. |
| Release Date: 11/28/2025 |
| Next Release Date: 12/31/2025 |