|
Download Data (XLS File) |
|
||||||||
|
||||||||
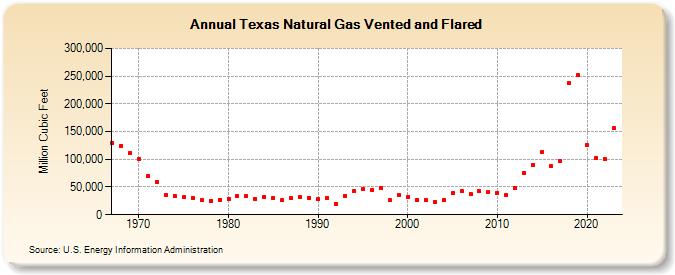
| Texas Natural Gas Vented and Flared (Million Cubic Feet) | ||||||||
| Decade | Year-0 | Year-1 | Year-2 | Year-3 | Year-4 | Year-5 | Year-6 | Year-7 | Year-8 | Year-9 |
|---|---|---|---|---|---|---|---|---|---|---|
| 1960's | 129,403 | 124,584 | 111,499 | |||||||
| 1970's | 100,305 | 70,222 | 59,821 | 36,133 | 34,431 | 31,295 | 30,402 | 27,340 | 25,556 | 27,350 |
| 1980's | 28,837 | 32,907 | 33,061 | 28,420 | 32,256 | 30,776 | 26,050 | 29,325 | 31,832 | 29,770 |
| 1990's | 28,247 | 30,638 | 19,689 | 34,486 | 42,037 | 46,183 | 45,382 | 47,922 | 25,949 | 35,675 |
| 2000's | 32,010 | 26,823 | 27,379 | 23,781 | 26,947 | 38,654 | 43,169 | 36,682 | 42,541 | 41,234 |
| 2010's | 39,569 | 35,248 | 47,530 | 76,113 | 90,125 | 113,786 | 87,527 | 96,946 | 238,054 | 251,186 |
| 2020's | 125,336 | 102,267 | 99,698 | 156,021 | 163,512 |
| - = No Data Reported; -- = Not Applicable; NA = Not Available; W = Withheld to avoid disclosure of individual company data. |
| Release Date: 6/30/2026 |
| Next Release Date: 7/31/2026 |