|
Download Data (XLS File) |
|
||||||||
|
||||||||
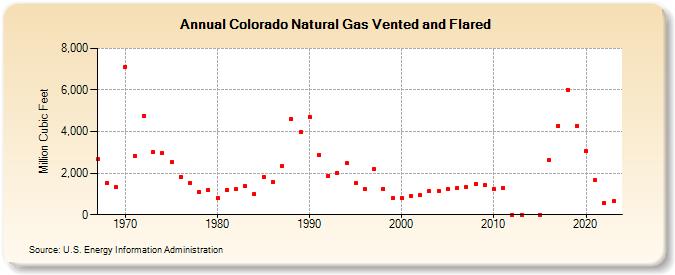
| Colorado Natural Gas Vented and Flared (Million Cubic Feet) | ||||||||
| Decade | Year-0 | Year-1 | Year-2 | Year-3 | Year-4 | Year-5 | Year-6 | Year-7 | Year-8 | Year-9 |
|---|---|---|---|---|---|---|---|---|---|---|
| 1960's | 2,656 | 1,514 | 1,326 | |||||||
| 1970's | 7,126 | 2,843 | 4,758 | 3,008 | 2,957 | 2,516 | 1,836 | 1,528 | 1,108 | 1,199 |
| 1980's | 796 | 1,195 | 1,223 | 1,360 | 1,000 | 1,821 | 1,577 | 2,360 | 4,593 | 3,961 |
| 1990's | 4,719 | 2,890 | 1,868 | 2,024 | 2,476 | 1,510 | 1,230 | 2,178 | 1,244 | 802 |
| 2000's | 805 | 908 | 935 | 1,123 | 1,158 | 1,215 | 1,291 | 1,333 | 1,501 | 1,411 |
| 2010's | 1,242 | 1,291 | 0 | 0 | NA | 0 | 2,620 | 4,279 | 6,021 | 4,279 |
| 2020's | 3,044 | 1,653 | 566 | 632 | 219 |
| - = No Data Reported; -- = Not Applicable; NA = Not Available; W = Withheld to avoid disclosure of individual company data. |
| Release Date: 6/30/2026 |
| Next Release Date: 7/31/2026 |