|
Download Data (XLS File) |
|
||||||||
|
||||||||
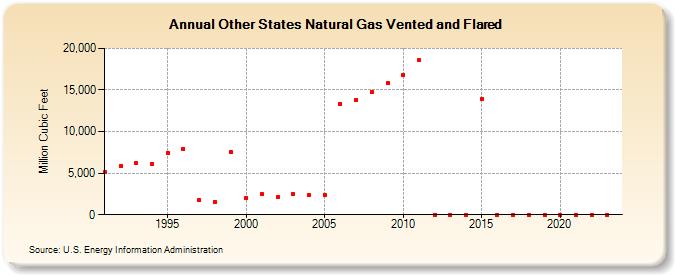
| Other States Natural Gas Vented and Flared (Million Cubic Feet) | ||||||||
| Decade | Year-0 | Year-1 | Year-2 | Year-3 | Year-4 | Year-5 | Year-6 | Year-7 | Year-8 | Year-9 |
|---|---|---|---|---|---|---|---|---|---|---|
| 1990's | 5,109 | 5,883 | 6,176 | 6,137 | 7,435 | 7,909 | 1,778 | 1,576 | 7,564 | |
| 2000's | 2,012 | 2,473 | 2,135 | 2,467 | 2,399 | 2,342 | 13,372 | 13,786 | 14,704 | 15,863 |
| 2010's | 16,785 | 18,549 | 0 | 0 | 0 | 13,957 | 0 | 0 | 7 | 0 |
| 2020's | 0 | 0 | 0 | 0 | 0 |
| - = No Data Reported; -- = Not Applicable; NA = Not Available; W = Withheld to avoid disclosure of individual company data. |
| Release Date: 5/29/2026 |
| Next Release Date: 6/30/2026 |