|
Download Data (XLS File) |
|
||||||||
|
||||||||
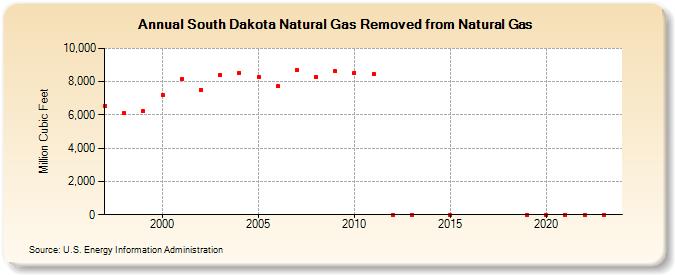
| South Dakota Natural Gas Removed from Natural Gas (Million Cubic Feet) | ||||||||
| Decade | Year-0 | Year-1 | Year-2 | Year-3 | Year-4 | Year-5 | Year-6 | Year-7 | Year-8 | Year-9 |
|---|---|---|---|---|---|---|---|---|---|---|
| 1990's | 6,557 | 6,106 | 6,219 | |||||||
| 2000's | 7,223 | 8,170 | 7,519 | 8,401 | 8,541 | 8,286 | 7,723 | 8,708 | 8,291 | 8,638 |
| 2010's | 8,543 | 8,480 | 0 | 0 | NA | 0 | NA | NA | NA | 0 |
| 2020's | 0 | 0 | 0 | 0 | 0 |
| - = No Data Reported; -- = Not Applicable; NA = Not Available; W = Withheld to avoid disclosure of individual company data. |
| Release Date: 6/30/2026 |
| Next Release Date: 7/31/2026 |