|
Download Data (XLS File) |
|
||||||||
|
||||||||
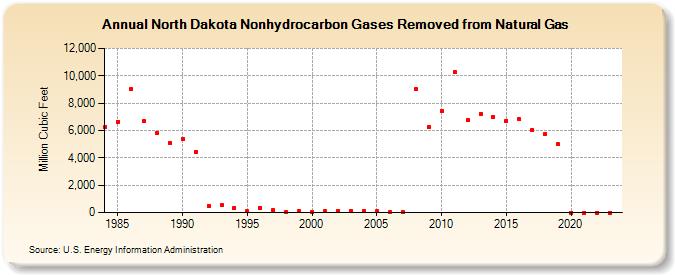
| North Dakota Nonhydrocarbon Gases Removed from Natural Gas (Million Cubic Feet) | ||||||||
| Decade | Year-0 | Year-1 | Year-2 | Year-3 | Year-4 | Year-5 | Year-6 | Year-7 | Year-8 | Year-9 |
|---|---|---|---|---|---|---|---|---|---|---|
| 1980's | 6,238 | 6,656 | 9,004 | 6,708 | 5,800 | 5,102 | ||||
| 1990's | 5,393 | 4,447 | 508 | 532 | 358 | 93 | 358 | 161 | 57 | 78 |
| 2000's | 73 | 89 | 139 | 123 | 126 | 87 | 53 | 42 | 9,044 | 6,244 |
| 2010's | 7,448 | 10,271 | 6,762 | 7,221 | 7,008 | 6,708 | 6,807 | 6,047 | 5,764 | 4,986 |
| 2020's | 0 | 0 | 0 | 0 | 0 |
| - = No Data Reported; -- = Not Applicable; NA = Not Available; W = Withheld to avoid disclosure of individual company data. |
| Release Date: 6/30/2026 |
| Next Release Date: 7/31/2026 |