|
Download Data (XLS File) |
|
||||||||
|
||||||||
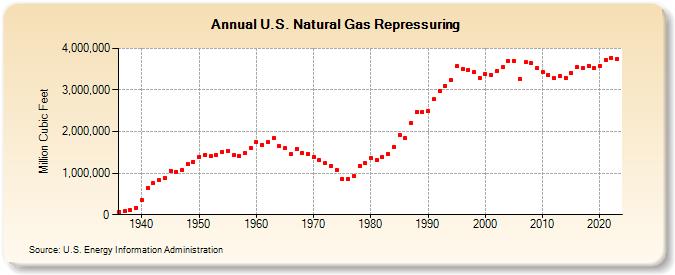
| U.S. Natural Gas Repressuring (Million Cubic Feet) | ||||||||
| Decade | Year-0 | Year-1 | Year-2 | Year-3 | Year-4 | Year-5 | Year-6 | Year-7 | Year-8 | Year-9 |
|---|---|---|---|---|---|---|---|---|---|---|
| 1930's | 73,507 | 84,925 | 101,551 | 171,401 | ||||||
| 1940's | 362,916 | 644,379 | 752,619 | 824,803 | 882,979 | 1,061,951 | 1,038,242 | 1,083,119 | 1,220,579 | 1,273,205 |
| 1950's | 1,396,546 | 1,438,827 | 1,410,501 | 1,438,606 | 1,518,737 | 1,540,804 | 1,426,648 | 1,417,263 | 1,482,975 | 1,612,109 |
| 1960's | 1,753,996 | 1,682,754 | 1,736,722 | 1,843,297 | 1,647,108 | 1,604,204 | 1,451,516 | 1,590,574 | 1,486,092 | 1,455,205 |
| 1970's | 1,376,351 | 1,310,458 | 1,236,292 | 1,171,361 | 1,079,890 | 860,956 | 859,410 | 934,801 | 1,181,432 | 1,245,074 |
| 1980's | 1,365,454 | 1,311,735 | 1,388,392 | 1,458,054 | 1,630,152 | 1,915,197 | 1,837,552 | 2,207,559 | 2,478,382 | 2,475,179 |
| 1990's | 2,489,040 | 2,771,928 | 2,972,552 | 3,103,014 | 3,230,667 | 3,565,023 | 3,510,753 | 3,491,542 | 3,427,045 | 3,292,564 |
| 2000's | 3,379,661 | 3,370,832 | 3,455,145 | 3,547,781 | 3,701,656 | 3,699,535 | 3,264,929 | 3,662,685 | 3,638,622 | 3,522,090 |
| 2010's | 3,431,587 | 3,365,313 | 3,277,588 | 3,331,456 | 3,291,091 | 3,412,269 | 3,548,106 | 3,538,733 | 3,587,368 | 3,521,924 |
| 2020's | 3,580,429 | 3,721,344 | 3,778,592 | 3,752,497 | 3,855,413 |
| - = No Data Reported; -- = Not Applicable; NA = Not Available; W = Withheld to avoid disclosure of individual company data. |
| Release Date: 6/30/2026 |
| Next Release Date: 7/31/2026 |