|
Download Data (XLS File) |
|
||||||||
|
||||||||
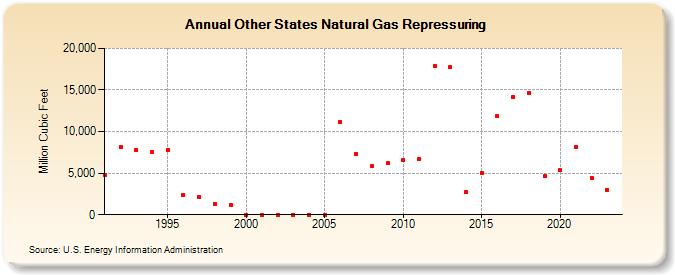
| Other States Natural Gas Repressuring (Million Cubic Feet) | ||||||||
| Decade | Year-0 | Year-1 | Year-2 | Year-3 | Year-4 | Year-5 | Year-6 | Year-7 | Year-8 | Year-9 |
|---|---|---|---|---|---|---|---|---|---|---|
| 1990's | 4,800 | 8,086 | 7,792 | 7,503 | 7,815 | 2,354 | 2,139 | 1,293 | 1,150 | |
| 2000's | 8 | 0 | 0 | 0 | 0 | 0 | 11,164 | 7,333 | 5,813 | 6,161 |
| 2010's | 6,555 | 6,659 | 17,909 | 17,718 | 2,682 | 5,026 | 11,835 | 14,162 | 14,636 | 4,599 |
| 2020's | 5,325 | 8,106 | 4,436 | 3,001 | 4,098 |
| - = No Data Reported; -- = Not Applicable; NA = Not Available; W = Withheld to avoid disclosure of individual company data. |
| Release Date: 7/31/2026 |
| Next Release Date: 8/31/2026 |