|
Download Data (XLS File) |
|
||||||||
|
||||||||
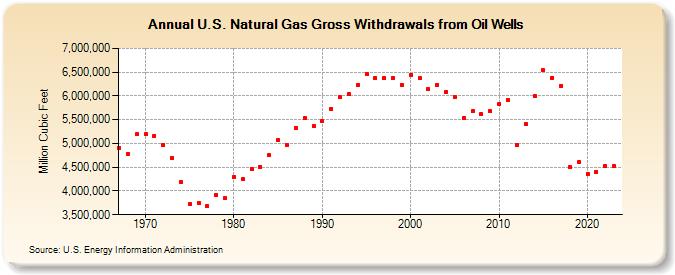
| U.S. Natural Gas Gross Withdrawals from Oil Wells (Million Cubic Feet) | ||||||||
| Decade | Year-0 | Year-1 | Year-2 | Year-3 | Year-4 | Year-5 | Year-6 | Year-7 | Year-8 | Year-9 |
|---|---|---|---|---|---|---|---|---|---|---|
| 1960's | 4,906,354 | 4,785,075 | 5,189,780 | |||||||
| 1970's | 5,191,795 | 5,162,895 | 4,973,517 | 4,695,602 | 4,180,581 | 3,723,237 | 3,753,123 | 3,681,088 | 3,914,602 | 3,849,474 |
| 1980's | 4,297,166 | 4,250,591 | 4,463,408 | 4,506,182 | 4,753,978 | 5,071,328 | 4,976,923 | 5,333,237 | 5,532,229 | 5,365,564 |
| 1990's | 5,469,055 | 5,732,482 | 5,967,376 | 6,034,504 | 6,229,645 | 6,461,596 | 6,376,201 | 6,368,631 | 6,379,608 | 6,232,524 |
| 2000's | 6,447,820 | 6,371,371 | 6,146,420 | 6,237,176 | 6,084,431 | 5,984,975 | 5,539,464 | 5,681,871 | 5,609,425 | 5,674,120 |
| 2010's | 5,834,703 | 5,907,919 | 4,965,833 | 5,404,699 | 5,999,955 | 6,537,627 | 6,385,120 | 6,217,438 | 4,503,499 | 4,603,548 |
| 2020's | 4,362,940 | 4,408,663 | 4,523,707 | 4,518,632 | 4,563,269 |
| - = No Data Reported; -- = Not Applicable; NA = Not Available; W = Withheld to avoid disclosure of individual company data. |
| Release Date: 6/30/2026 |
| Next Release Date: 7/31/2026 |