|
Download Data (XLS File) |
|
||||||||
|
||||||||
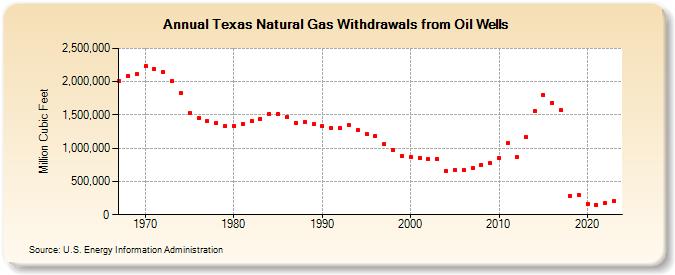
| Texas Natural Gas Withdrawals from Oil Wells (Million Cubic Feet) | ||||||||
| Decade | Year-0 | Year-1 | Year-2 | Year-3 | Year-4 | Year-5 | Year-6 | Year-7 | Year-8 | Year-9 |
|---|---|---|---|---|---|---|---|---|---|---|
| 1960's | 2,011,361 | 2,088,647 | 2,113,912 | |||||||
| 1970's | 2,233,138 | 2,191,458 | 2,140,575 | 2,007,141 | 1,829,171 | 1,525,678 | 1,452,537 | 1,405,839 | 1,375,507 | 1,330,901 |
| 1980's | 1,333,881 | 1,365,878 | 1,409,147 | 1,440,840 | 1,515,689 | 1,517,238 | 1,466,649 | 1,382,247 | 1,400,362 | 1,357,343 |
| 1990's | 1,332,316 | 1,306,851 | 1,301,756 | 1,342,368 | 1,268,127 | 1,212,503 | 1,184,565 | 1,056,344 | 967,770 | 883,849 |
| 2000's | 869,584 | 855,081 | 832,816 | 843,735 | 659,851 | 675,061 | 676,649 | 704,092 | 745,587 | 774,821 |
| 2010's | 849,560 | 1,073,301 | 860,675 | 1,166,810 | 1,558,002 | 1,803,086 | 1,680,873 | 1,569,154 | 287,648 | 302,943 |
| 2020's | 162,427 | 152,951 | 176,472 | 198,477 | 195,534 |
| - = No Data Reported; -- = Not Applicable; NA = Not Available; W = Withheld to avoid disclosure of individual company data. |
| Release Date: 6/30/2026 |
| Next Release Date: 7/31/2026 |