|
Download Data (XLS File) |
|
||||||||
|
||||||||
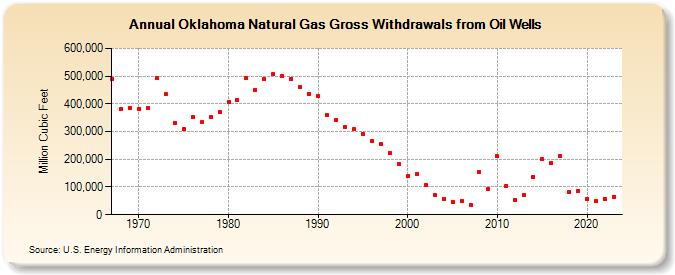
| Oklahoma Natural Gas Gross Withdrawals from Oil Wells (Million Cubic Feet) | ||||||||
| Decade | Year-0 | Year-1 | Year-2 | Year-3 | Year-4 | Year-5 | Year-6 | Year-7 | Year-8 | Year-9 |
|---|---|---|---|---|---|---|---|---|---|---|
| 1960's | 488,173 | 380,957 | 384,911 | |||||||
| 1970's | 381,596 | 383,239 | 492,223 | 434,494 | 331,346 | 308,061 | 351,024 | 333,271 | 353,237 | 370,402 |
| 1980's | 404,993 | 413,943 | 492,375 | 449,992 | 488,610 | 507,279 | 500,835 | 490,753 | 461,407 | 435,274 |
| 1990's | 428,091 | 359,714 | 342,950 | 316,945 | 308,006 | 289,877 | 267,192 | 253,770 | 223,079 | 184,068 |
| 2000's | 139,097 | 148,551 | 105,402 | 70,704 | 57,854 | 46,786 | 48,597 | 35,186 | 153,227 | 92,467 |
| 2010's | 210,492 | 104,703 | 53,720 | 71,515 | 136,270 | 199,259 | 185,482 | 210,289 | 81,673 | 84,792 |
| 2020's | 56,936 | 49,096 | 56,922 | 66,811 | 74,966 |
| - = No Data Reported; -- = Not Applicable; NA = Not Available; W = Withheld to avoid disclosure of individual company data. |
| Release Date: 6/30/2026 |
| Next Release Date: 7/31/2026 |