|
Download Data (XLS File) |
|
||||||||
|
||||||||
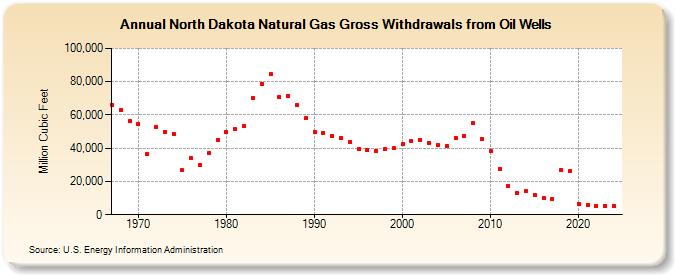
| North Dakota Natural Gas Gross Withdrawals from Oil Wells (Million Cubic Feet) | ||||||||
| Decade | Year-0 | Year-1 | Year-2 | Year-3 | Year-4 | Year-5 | Year-6 | Year-7 | Year-8 | Year-9 |
|---|---|---|---|---|---|---|---|---|---|---|
| 1960's | 65,992 | 62,848 | 56,415 | |||||||
| 1970's | 54,611 | 36,404 | 52,661 | 49,954 | 48,779 | 26,654 | 33,922 | 29,978 | 37,013 | 45,151 |
| 1980's | 49,841 | 51,620 | 53,373 | 70,268 | 78,598 | 84,438 | 70,703 | 71,612 | 66,093 | 58,070 |
| 1990's | 49,854 | 49,298 | 47,518 | 46,059 | 43,640 | 39,760 | 38,906 | 38,107 | 39,394 | 39,820 |
| 2000's | 42,262 | 44,141 | 44,848 | 43,362 | 41,768 | 41,350 | 46,351 | 47,335 | 54,896 | 45,776 |
| 2010's | 38,306 | 27,739 | 17,434 | 12,854 | 13,973 | 11,561 | 10,138 | 9,186 | 26,966 | 26,325 |
| 2020's | 6,732 | 5,881 | 5,335 | 5,361 | 5,134 |
| - = No Data Reported; -- = Not Applicable; NA = Not Available; W = Withheld to avoid disclosure of individual company data. |
| Release Date: 5/29/2026 |
| Next Release Date: 6/30/2026 |