|
Download Data (XLS File) |
|
||||||||
|
||||||||
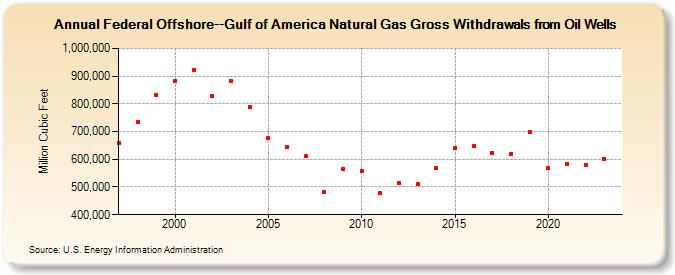
| Federal Offshore--Gulf of America Natural Gas Gross Withdrawals from Oil Wells (Million Cubic Feet) | ||||||||
| Decade | Year-0 | Year-1 | Year-2 | Year-3 | Year-4 | Year-5 | Year-6 | Year-7 | Year-8 | Year-9 |
|---|---|---|---|---|---|---|---|---|---|---|
| 1990's | 660,077 | 733,270 | 830,259 | |||||||
| 2000's | 882,336 | 922,935 | 828,458 | 883,465 | 787,047 | 677,426 | 643,556 | 610,955 | 481,665 | 566,380 |
| 2010's | 559,235 | 476,984 | 513,961 | 509,357 | 569,023 | 639,856 | 647,628 | 623,547 | 620,276 | 697,149 |
| 2020's | 569,407 | 582,234 | 579,639 | 602,116 | 570,260 |
| - = No Data Reported; -- = Not Applicable; NA = Not Available; W = Withheld to avoid disclosure of individual company data. |
| Release Date: 6/30/2026 |
| Next Release Date: 7/31/2026 |