|
Download Data (XLS File) |
|
||||||||
|
||||||||
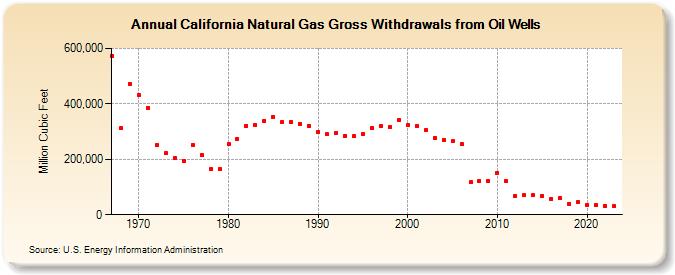
| California Natural Gas Gross Withdrawals from Oil Wells (Million Cubic Feet) | ||||||||
| Decade | Year-0 | Year-1 | Year-2 | Year-3 | Year-4 | Year-5 | Year-6 | Year-7 | Year-8 | Year-9 |
|---|---|---|---|---|---|---|---|---|---|---|
| 1960's | 573,639 | 311,320 | 473,316 | |||||||
| 1970's | 431,244 | 385,990 | 251,343 | 221,602 | 204,301 | 194,154 | 253,163 | 215,897 | 163,128 | 164,721 |
| 1980's | 254,710 | 274,357 | 321,364 | 323,370 | 339,636 | 353,105 | 333,317 | 334,092 | 326,346 | 319,722 |
| 1990's | 299,748 | 289,594 | 294,800 | 285,162 | 282,227 | 289,430 | 313,581 | 318,852 | 316,472 | 342,372 |
| 2000's | 324,400 | 320,048 | 304,972 | 278,072 | 269,004 | 264,445 | 254,526 | 116,652 | 122,345 | 121,949 |
| 2010's | 151,369 | 120,880 | 67,065 | 69,839 | 70,475 | 69,168 | 57,157 | 58,962 | 39,959 | 45,270 |
| 2020's | 36,444 | 34,716 | 31,541 | 30,407 | 26,852 |
| - = No Data Reported; -- = Not Applicable; NA = Not Available; W = Withheld to avoid disclosure of individual company data. |
| Release Date: 6/30/2026 |
| Next Release Date: 7/31/2026 |