|
Download Data (XLS File) |
|
||||||||
|
||||||||
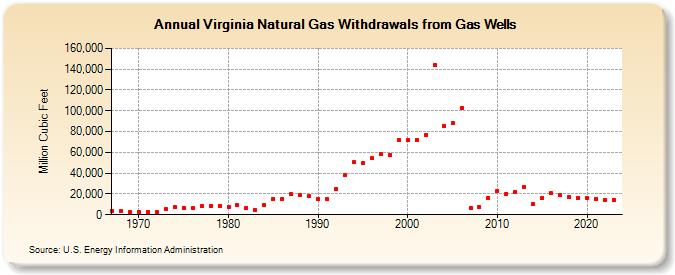
| Virginia Natural Gas Withdrawals from Gas Wells (Million Cubic Feet) | ||||||||
| Decade | Year-0 | Year-1 | Year-2 | Year-3 | Year-4 | Year-5 | Year-6 | Year-7 | Year-8 | Year-9 |
|---|---|---|---|---|---|---|---|---|---|---|
| 1960's | 3,818 | 3,389 | 2,846 | |||||||
| 1970's | 2,805 | 2,619 | 2,787 | 5,101 | 7,096 | 6,723 | 6,937 | 8,220 | 8,492 | 8,544 |
| 1980's | 7,812 | 8,903 | 6,880 | 4,346 | 8,928 | 15,041 | 15,427 | 19,520 | 18,682 | 17,935 |
| 1990's | 14,774 | 14,906 | 24,733 | 37,840 | 50,259 | 49,818 | 54,290 | 58,249 | 57,263 | 72,189 |
| 2000's | 71,545 | 71,543 | 76,915 | 143,644 | 85,508 | 88,610 | 103,027 | 6,681 | 7,419 | 16,046 |
| 2010's | 23,086 | 20,375 | 21,802 | 26,815 | 10,143 | 16,431 | 20,549 | 19,234 | 17,147 | 16,495 |
| 2020's | 15,971 | 15,230 | 14,610 | 13,534 | 13,686 |
| - = No Data Reported; -- = Not Applicable; NA = Not Available; W = Withheld to avoid disclosure of individual company data. |
| Release Date: 6/30/2026 |
| Next Release Date: 7/31/2026 |