|
Download Data (XLS File) |
|
||||||||
|
||||||||
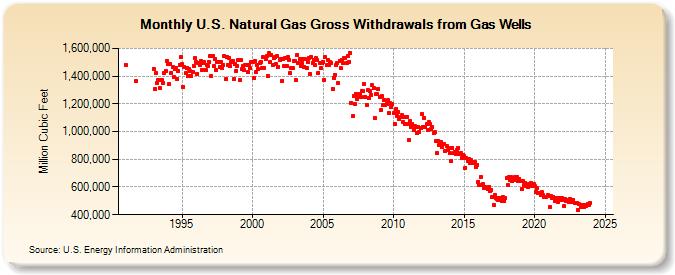
| U.S. Natural Gas Gross Withdrawals from Gas Wells (Million Cubic Feet) | ||||||||
| Year | Jan | Feb | Mar | Apr | May | Jun | Jul | Aug | Sep | Oct | Nov | Dec |
|---|---|---|---|---|---|---|---|---|---|---|---|---|
| 1991 | 1,482,053 | 1,363,737 | ||||||||||
| 1993 | 1,452,098 | 1,305,490 | 1,420,719 | 1,349,960 | 1,374,045 | 1,316,448 | 1,374,565 | 1,374,824 | 1,352,121 | 1,424,561 | 1,435,581 | 1,510,727 |
| 1994 | 1,487,815 | 1,341,637 | 1,489,504 | 1,422,603 | 1,466,838 | 1,394,919 | 1,449,773 | 1,457,931 | 1,379,647 | 1,437,632 | 1,482,072 | 1,540,690 |
| 1995 | 1,487,207 | 1,324,526 | 1,465,860 | 1,419,248 | 1,461,017 | 1,404,089 | 1,447,888 | 1,435,325 | 1,400,318 | 1,431,457 | 1,474,766 | 1,530,330 |
| 1996 | 1,499,471 | 1,418,460 | 1,497,139 | 1,477,216 | 1,509,627 | 1,445,965 | 1,492,362 | 1,500,437 | 1,443,804 | 1,480,154 | 1,470,322 | 1,502,402 |
| 1997 | 1,545,720 | 1,397,900 | 1,546,405 | 1,473,932 | 1,525,001 | 1,440,794 | 1,504,999 | 1,500,784 | 1,467,467 | 1,503,523 | 1,455,568 | 1,481,988 |
| 1998 | 1,543,944 | 1,375,574 | 1,536,229 | 1,482,841 | 1,532,317 | 1,469,772 | 1,499,489 | 1,511,626 | 1,377,167 | 1,487,808 | 1,437,187 | 1,474,565 |
| 1999 | 1,519,828 | 1,371,577 | 1,516,696 | 1,448,589 | 1,471,196 | 1,440,555 | 1,480,127 | 1,476,939 | 1,428,504 | 1,480,719 | 1,456,680 | 1,498,776 |
| 2000 | 1,500,689 | 1,386,089 | 1,509,267 | 1,430,754 | 1,482,754 | 1,447,790 | 1,494,463 | 1,504,043 | 1,457,946 | 1,537,320 | 1,459,173 | 1,524,111 |
| 2001 | 1,546,300 | 1,403,555 | 1,563,329 | 1,502,213 | 1,553,485 | 1,479,003 | 1,527,743 | 1,537,215 | 1,487,642 | 1,543,334 | 1,465,831 | 1,519,758 |
| 2002 | 1,520,193 | 1,368,103 | 1,526,142 | 1,474,364 | 1,530,867 | 1,473,359 | 1,538,781 | 1,516,307 | 1,424,105 | 1,457,092 | 1,456,391 | 1,509,154 |
| 2003 | 1,506,749 | 1,371,901 | 1,554,621 | 1,494,461 | 1,519,868 | 1,472,112 | 1,496,631 | 1,522,279 | 1,464,096 | 1,520,182 | 1,456,967 | 1,501,934 |
| 2004 | 1,532,749 | 1,418,026 | 1,538,681 | 1,494,374 | 1,514,712 | 1,478,979 | 1,527,786 | 1,512,791 | 1,424,864 | 1,493,725 | 1,457,249 | 1,491,312 |
| 2005 | 1,505,374 | 1,373,818 | 1,537,205 | 1,476,787 | 1,519,640 | 1,480,651 | 1,500,786 | 1,495,336 | 1,309,037 | 1,384,951 | 1,409,999 | 1,478,263 |
| 2006 | 1,494,607 | 1,350,470 | 1,509,581 | 1,458,547 | 1,518,803 | 1,493,807 | 1,530,932 | 1,531,447 | 1,491,023 | 1,545,414 | 1,504,834 | 1,566,091 |
| 2007 | 1,208,647 | 1,109,144 | 1,256,526 | 1,197,836 | 1,273,889 | 1,237,733 | 1,261,842 | 1,272,772 | 1,251,805 | 1,291,776 | 1,289,592 | 1,340,328 |
| 2008 | 1,252,450 | 1,194,793 | 1,297,482 | 1,244,781 | 1,289,355 | 1,266,631 | 1,332,342 | 1,312,278 | 1,099,286 | 1,267,363 | 1,267,551 | 1,310,331 |
| 2009 | 1,251,742 | 1,155,107 | 1,253,396 | 1,192,387 | 1,227,955 | 1,193,379 | 1,202,314 | 1,224,882 | 1,134,504 | 1,202,397 | 1,178,120 | 1,198,103 |
| 2010 | 1,133,912 | 1,052,308 | 1,160,678 | 1,114,216 | 1,144,376 | 1,089,664 | 1,103,493 | 1,116,748 | 1,069,752 | 1,103,121 | 1,055,096 | 1,104,134 |
| 2011 | 1,055,851 | 938,227 | 1,073,020 | 1,033,091 | 1,057,528 | 1,012,955 | 1,039,485 | 1,029,990 | 992,944 | 1,031,751 | 999,917 | 1,026,310 |
| 2012 | 1,125,753 | 1,032,209 | 1,099,787 | 1,032,068 | 1,055,642 | 1,008,131 | 1,066,571 | 1,051,540 | 1,020,391 | 1,029,999 | 988,465 | 993,671 |
| 2013 | 933,301 | 846,692 | 932,103 | 905,886 | 923,166 | 891,462 | 913,497 | 910,896 | 859,246 | 897,422 | 863,925 | 881,949 |
| 2014 | 842,317 | 789,097 | 881,366 | 844,658 | 852,465 | 835,510 | 863,511 | 884,007 | 841,238 | 844,552 | 810,902 | 833,795 |
| 2015 | 822,957 | 738,852 | 810,904 | 789,264 | 803,572 | 773,933 | 794,462 | 780,568 | 770,977 | 777,128 | 746,850 | 761,813 |
| 2016 | 638,346 | 616,281 | 672,249 | 616,021 | 622,639 | 589,857 | 603,497 | 590,207 | 584,167 | 601,760 | 571,539 | 581,295 |
| 2017 | 525,828 | 472,047 | 543,939 | 517,704 | 516,713 | 506,113 | 518,613 | 517,848 | 500,187 | 526,830 | 496,469 | 519,127 |
| 2018 | 665,082 | 611,498 | 669,220 | 646,869 | 669,082 | 642,749 | 666,257 | 672,050 | 648,863 | 668,904 | 642,685 | 660,804 |
| 2019 | 644,510 | 585,129 | 639,820 | 617,631 | 630,261 | 608,327 | 602,982 | 624,041 | 618,881 | 630,510 | 607,175 | 624,021 |
| 2020 | 604,082 | 563,921 | 591,476 | 556,747 | 554,312 | 540,793 | 563,375 | 543,985 | 524,899 | 530,668 | 527,518 | 541,581 |
| 2021 | 533,310 | 454,669 | 534,655 | 518,088 | 530,948 | 501,094 | 520,485 | 513,991 | 492,754 | 521,313 | 504,046 | 519,509 |
| 2022 | 503,008 | 460,048 | 514,949 | 500,058 | 504,513 | 489,697 | 513,743 | 507,244 | 494,531 | 508,684 | 485,787 | 481,745 |
| 2023 | 488,443 | 432,209 | 474,377 | 459,020 | 475,489 | 457,070 | 459,056 | 473,219 | 460,629 | 479,383 | 469,602 | 485,881 |
| 2024 | 474,581 | 449,743 | 468,865 | 447,673 | 464,636 | 456,412 | 461,882 | 459,890 | 438,549 | 455,495 | 451,182 | 480,498 |
| 2025 | NA | NA | NA | NA | NA | NA | NA | NA | NA | NA | NA | NA |
| 2026 | NA | NA | NA | NA | ||||||||
| - = No Data Reported; -- = Not Applicable; NA = Not Available; W = Withheld to avoid disclosure of individual company data. |
| Release Date: 6/30/2026 |
| Next Release Date: 7/31/2026 |