|
Download Data (XLS File) |
|
||||||||
|
||||||||
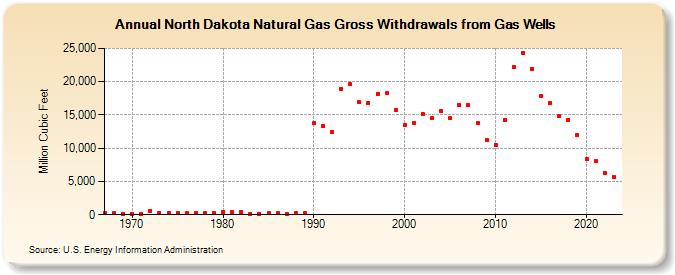
| North Dakota Natural Gas Gross Withdrawals from Gas Wells (Million Cubic Feet) | ||||||||
| Decade | Year-0 | Year-1 | Year-2 | Year-3 | Year-4 | Year-5 | Year-6 | Year-7 | Year-8 | Year-9 |
|---|---|---|---|---|---|---|---|---|---|---|
| 1960's | 265 | 225 | 127 | |||||||
| 1970's | 140 | 146 | 597 | 282 | 287 | 287 | 285 | 311 | 274 | 249 |
| 1980's | 480 | 335 | 446 | 160 | 154 | 193 | 252 | 125 | 225 | 256 |
| 1990's | 13,736 | 13,359 | 12,461 | 18,892 | 19,592 | 16,914 | 16,810 | 18,186 | 18,220 | 15,813 |
| 2000's | 13,527 | 13,846 | 15,130 | 14,524 | 15,565 | 14,554 | 16,435 | 16,416 | 13,738 | 11,263 |
| 2010's | 10,501 | 14,287 | 22,261 | 24,313 | 21,956 | 17,900 | 16,817 | 14,891 | 14,300 | 11,964 |
| 2020's | 8,368 | 8,025 | 6,283 | 5,690 | 4,452 |
| - = No Data Reported; -- = Not Applicable; NA = Not Available; W = Withheld to avoid disclosure of individual company data. |
| Release Date: 6/30/2026 |
| Next Release Date: 7/31/2026 |